Menu
Math Lesson 14.2.1 - Definition of Gradient and the Difference in Meaning with Slope
Please provide a rating, it takes seconds and helps us to keep this resource free for all to use
Welcome to our Math lesson on Definition of Gradient and the Difference in Meaning with Slope, this is the first lesson of our suite of math lessons covering the topic of Slopes and Gradients, you can find links to the other lessons within this tutorial and access additional Math learning resources below this lesson.
Definition of Gradient and its Difference in Meaning with Slope
As stressed in the tutorial introduction, in many textbooks the terms 'slope' and 'gradient' - especially in the basic-level ones - are considered as having the same meaning. This can lead to confusion so it is important that we clarify the difference between them. Therefore, the first thing we will do in this tutorial is to explain the differences between these two terms, so that you will have a clearer idea of why a certain term is used in a specific situation.
In mathematics, when using the word 'slope' we commonly refer to a certain inclination that causes a motion, a line or a surface to diverge from the vertical or horizontal direction. Unlike in everyday life, where this term is associated with the inclination of a surface, the term 'slope' in math is mostly used to describe the overall feature of a graph without going into numerical details. In a certain sense, the term 'slope' is a synonym for 'steepness'.
The term 'gradient' is more number-oriented. It describes the rate of inclination in the sense that we have to calculate how much the vertical shift changes with respect to the horizontal shift when the position of a mathematical object (it can be simply a point) changes.
As we have seen in other tutorials when dealing with a 2-D graph (i.e. an X-Y graph), we make all calculations based on the origin of the coordinate system, which we consider as a reference point. In this sense, when giving the coordinates of a certain point, we tell how far from the origin this point is in the horizontal and vertical directions.
However, a line is not made of a single point but of an infinite number of points. Therefore, all graphs - linear and not - contain an infinity of points that change their coordinates gradually when shifting throughout that line. Look at the graph below.
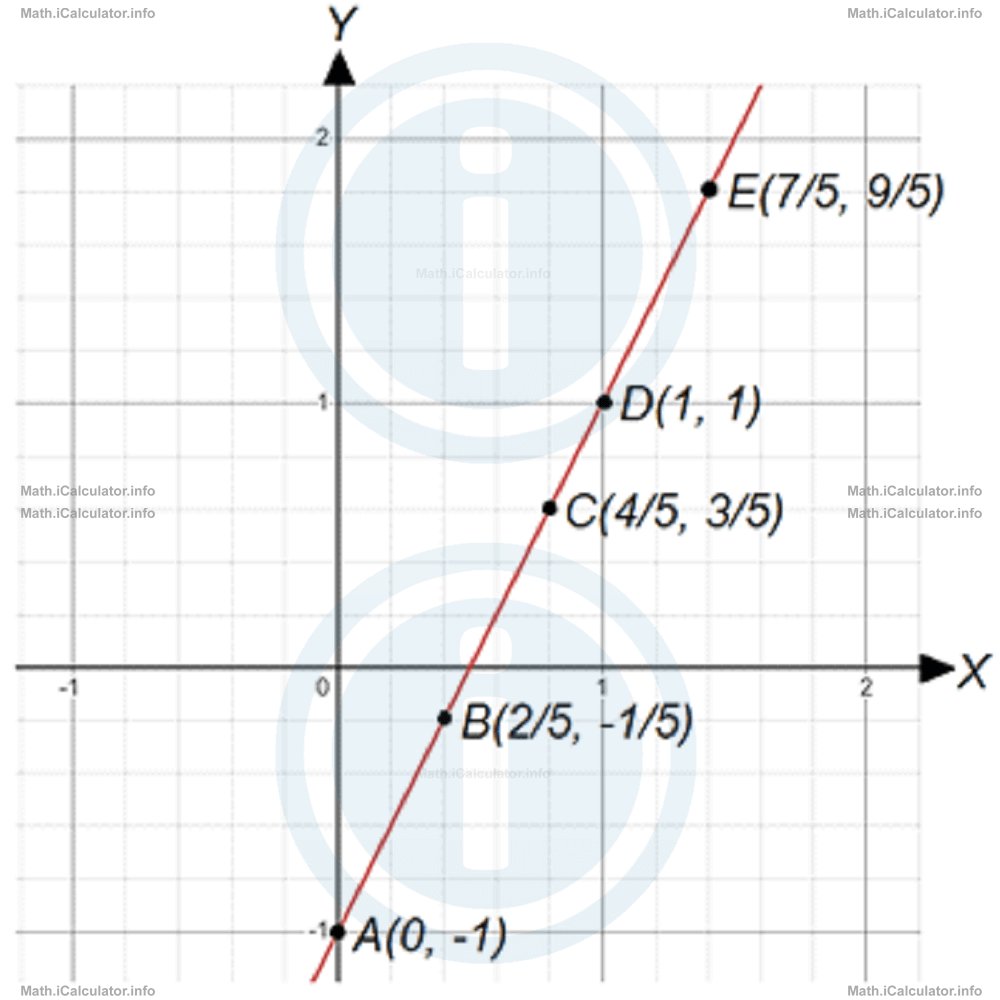
All points shown in the figure above (and many others) belong to the same straight line (are collinear). Since the line has the same steepness everywhere, we expect the gradient of this line to be the same number.
Indeed, as we covered earlier, the gradient k (or m) of a line represents the change in the vertical coordinate divided by the change in the horizontal coordinate.
When calculating the gradient of a line, we usually consider two known points and use their coordinates to find the value of the gradient.
In symbols, we write
where x1 and y1 are the coordinates of the leftmost point while x2 and y2 are the coordinates of the rightmost point considered. In linear graphs (straight lines), we can use any two points to calculate the gradient as the result will always be the same for any pair considered. Let's confirm this assumption by calculating the gradient of the line shown in the figure above. Thus, taking the points A and B (A is the leftmost point) yields
= - 1/5 - (-1)/2/5 - 0
= - 1/5 + 1/2/5
= - 1/5 + 5/5/2/5
= 4/5/2/5
= 4/5 ∙ 5/2
= 20/10
= 2
When taking into consideration points B and C, we obtain
= 3/5 - (-1/5)/4/5 - 2/5
= 3/5 + 1/5/2/5
= 4/5/2/5
= 4/5 ∙ 5/2
= 20/10
= 2
and so on.
As you see, the gradient of a linear graph is the same, no matter which points we take into consideration for calculating it. In our example, the gradient is 2. This means the y-coordinate changes twice faster than the x-coordinate in this graph. In this way, we obtain an alternative definition for the gradient:
The gradient of a linear graph shows how much faster the y-coordinates of any two points of that graph change compared to the corresponding x-coordinates.
In the functions-related terminology (we cover this in detail in chapter 16), the gradient is known as the "rate of a function's change." However, for now, we will not delve too much into that part of the mathematical analysis.
Example 1
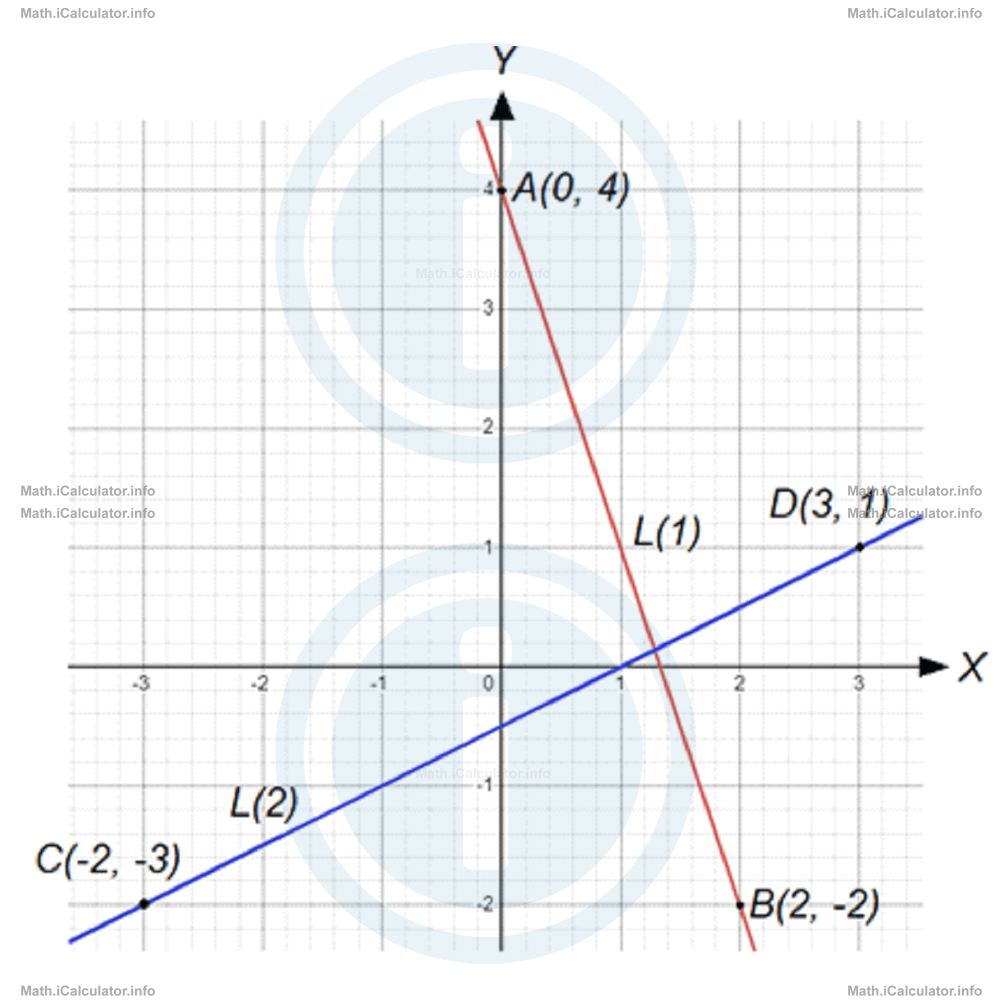
Use the coordinates of the two given points to calculate the gradients of the lines (1) and (2) shown in the figure.
Solution 1
Since we have a linear graph, we can take the coordinates of two points anywhere in the graph to calculate the gradient of the given lines. Often, it is preferred to take the intercepts with the X- and Y-axis since at these points one of the coordinates is zero, but this time we will take only the Y-intercept, as the x-coordinate in the X-intercept is not clear from the figure.
Therefore, for line (1) we consider the two points A and B in the figure, while for line (2), we consider the points C and D in the figure.
From the formula of gradient, we have for the gradient of the first line:
= -2 - 4/2 - 0
= -6/2
= -3
As for the gradient of the second line, we have
= 1 - (-3)/3 - (-2)
= 1 + 3/3 + 2
= 4/5
More Slopes and Gradients Lessons and Learning Resources
Whats next?
Enjoy the "Definition of Gradient and the Difference in Meaning with Slope" math lesson? People who liked the "Slopes and Gradients lesson found the following resources useful:
- Definition Feedback. Helps other - Leave a rating for this definition (see below)
- Linear Graphs Math tutorial: Slopes and Gradients. Read the Slopes and Gradients math tutorial and build your math knowledge of Linear Graphs
- Linear Graphs Revision Notes: Slopes and Gradients. Print the notes so you can revise the key points covered in the math tutorial for Slopes and Gradients
- Linear Graphs Practice Questions: Slopes and Gradients. Test and improve your knowledge of Slopes and Gradients with example questins and answers
- Check your calculations for Linear Graphs questions with our excellent Linear Graphs calculators which contain full equations and calculations clearly displayed line by line. See the Linear Graphs Calculators by iCalculator™ below.
- Continuing learning linear graphs - read our next math tutorial: Equation of Linear Graphs
Help others Learning Math just like you
Please provide a rating, it takes seconds and helps us to keep this resource free for all to use
We hope you found this Math tutorial "Slopes and Gradients" useful. If you did it would be great if you could spare the time to rate this math tutorial (simply click on the number of stars that match your assessment of this math learning aide) and/or share on social media, this helps us identify popular tutorials and calculators and expand our free learning resources to support our users around the world have free access to expand their knowledge of math and other disciplines.