Menu
Math Lesson 13.4.7 - Modelling the Exponential Curve using Natural Logarithm
Please provide a rating, it takes seconds and helps us to keep this resource free for all to use
Welcome to our Math lesson on Modelling the Exponential Curve using Natural Logarithm, this is the seventh lesson of our suite of math lessons covering the topic of Natural Logarithm Function and Its Graph, you can find links to the other lessons within this tutorial and access additional Math learning resources below this lesson.
Modelling the Exponential Curve using Natural Logarithm
In the previous tutorial, we explained that modelling an exponential curve means converting the graph of any exponential function into a linear one. This is also true for functions of the form
where a and b are coefficients (numbers) and x is the independent variable.
The procedure is similar to that used for modelling curves of the form
explained in the previous tutorial. Thus, first we take the 'ln' off both sides so we can remove Euler's Number e; then, we calculate the values of the new variables. After this step is complete, we plot the linear graph obtained by replacing the old x- and y-values with the ln x and ln y ones in a ln y vs ln x graph. For this, the function is transformed in the following way:
ln y = ln (a ∙ ebx )
ln y = ln a + ln ebx
ln y = ln a + bx ∙ ln e
ln y = ln a + bx ∙ 1
ln y = bx + ln a
The last form of this function is similar to that of the linear function
where in our case, b represents the gradient of the line and ln a is the constant.
Let's consider an example to clarify this point.
Example 3
The number of bacteria present in a laboratory sample taken from a patients blood after the start of his cure is given by the function
where y is the number of bacteria in the sample and x is the number of days after starting the cure.
- Plot a linear graph that depicts the relationship between the bacteria present in the blood sample and the number of days elapsed since the start of the cure to the 5th day.
- The patient is considered as healed when the number of bacteria in the sample is less than 20. How long does it take for this process?
Solution 3
- First, we transform the original function into a linear one. We have y(x) = 3000 ∙ e-1.4xNow, we make a table using the above formula to show the linear relationship between the two variables. Since we don't have the values of y, we can make a table containing three rows instead of two separate tables, as we don't need the values of ln x but only those of x. Thus, the first row is for the variable x, the second row for the variable y and the third row for ln y. We have
ln y = ln (3000 ∙ e-1.4x)
ln y = ln 3000 + ln e-1.4x
ln y = ln 3000 - 1.4x ln e
ln y = ln 3000 - 1.4x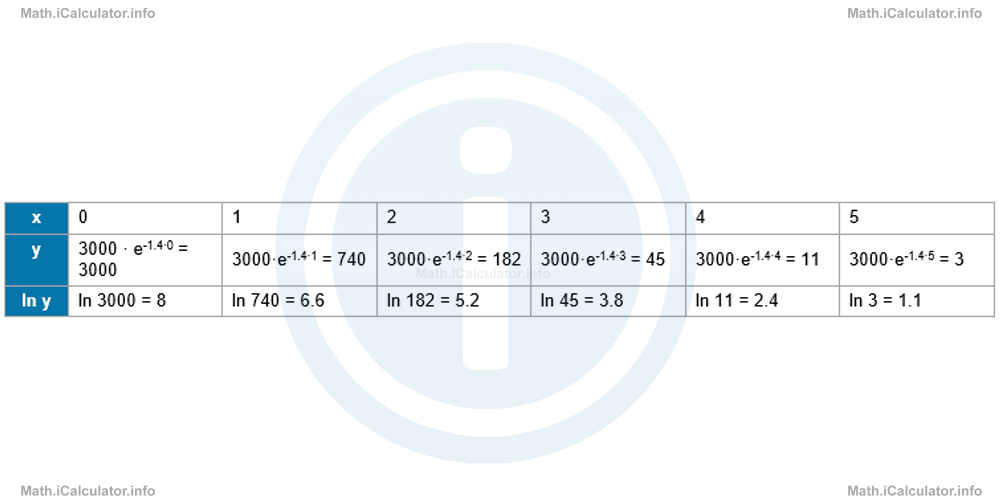 The ln y vs x graph for this relation is shown in the figure below.
 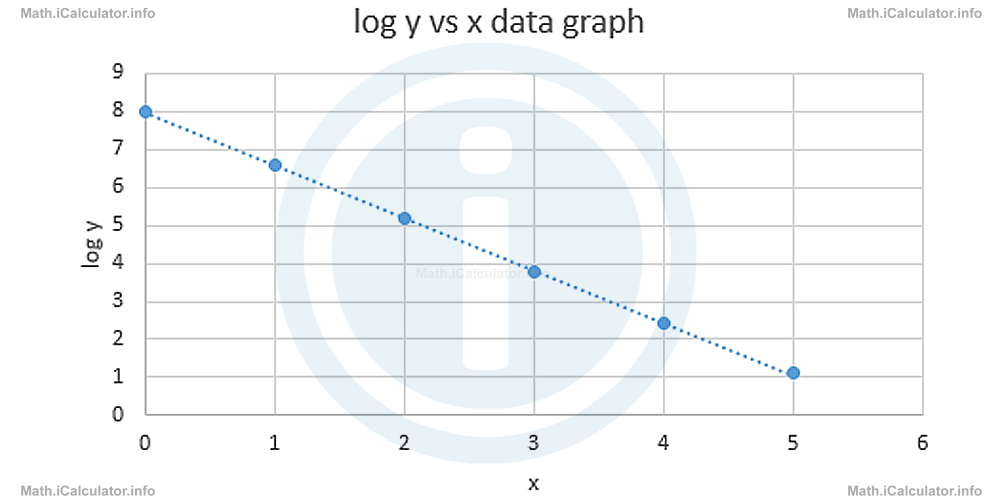 The above graph clearly shows the linear relationship required.
 - From the data found in the second row, it is clear that the patient is considered as healed in the fourth day of starting the cure, as in this day the number of bacteria present in the sample falls below 20.
More Natural Logarithm Function and Its Graph Lessons and Learning Resources
Whats next?
Enjoy the "Modelling the Exponential Curve using Natural Logarithm" math lesson? People who liked the "Natural Logarithm Function and Its Graph lesson found the following resources useful:
- Natural Logarithm Curve Feedback. Helps other - Leave a rating for this natural logarithm curve (see below)
- Logarithms Math tutorial: Natural Logarithm Function and Its Graph. Read the Natural Logarithm Function and Its Graph math tutorial and build your math knowledge of Logarithms
- Logarithms Video tutorial: Natural Logarithm Function and Its Graph. Watch or listen to the Natural Logarithm Function and Its Graph video tutorial, a useful way to help you revise when travelling to and from school/college
- Logarithms Revision Notes: Natural Logarithm Function and Its Graph. Print the notes so you can revise the key points covered in the math tutorial for Natural Logarithm Function and Its Graph
- Logarithms Practice Questions: Natural Logarithm Function and Its Graph. Test and improve your knowledge of Natural Logarithm Function and Its Graph with example questins and answers
- Check your calculations for Logarithms questions with our excellent Logarithms calculators which contain full equations and calculations clearly displayed line by line. See the Logarithms Calculators by iCalculator™ below.
- Continuing learning logarithms - read our next math tutorial: Definition and Properties of Logarithms
Help others Learning Math just like you
Please provide a rating, it takes seconds and helps us to keep this resource free for all to use
We hope you found this Math tutorial "Natural Logarithm Function and Its Graph" useful. If you did it would be great if you could spare the time to rate this math tutorial (simply click on the number of stars that match your assessment of this math learning aide) and/or share on social media, this helps us identify popular tutorials and calculators and expand our free learning resources to support our users around the world have free access to expand their knowledge of math and other disciplines.