Menu
Modelling Curves using Logarithms
Please provide a rating, it takes seconds and helps us to keep this resource free for all to use
The following math revision questions are provided in support of the math tutorial on Modelling Curves using Logarithms. In addition to this tutorial, we also provide revision notes, a video tutorial, revision questions on this page (which allow you to check your understanding of the topic) and calculators which provide full, step by step calculations for each of the formula in the Modelling Curves using Logarithms tutorials. The Modelling Curves using Logarithms calculators are particularly useful for ensuring your step-by-step calculations are correct as well as ensuring your final result is accurate.
Not sure on some or part of the Modelling Curves using Logarithms questions? Review the tutorials and learning material for Modelling Curves using Logarithms
| Tutorial ID | Title | Tutorial | Video Tutorial | Revision Notes | Revision Questions |
|---|---|---|---|---|---|
| 13.3 | Modelling Curves using Logarithms |
Modelling Curves using Logarithms Revision Questions
1. . Which of the following is NOT a function?
- x2 + y2 = 9
- x + y = 9
- x2 + y = 9
- x · y = 9
Correct Answer: A
2. . Which of the following figures does NOT show the graph of a function?
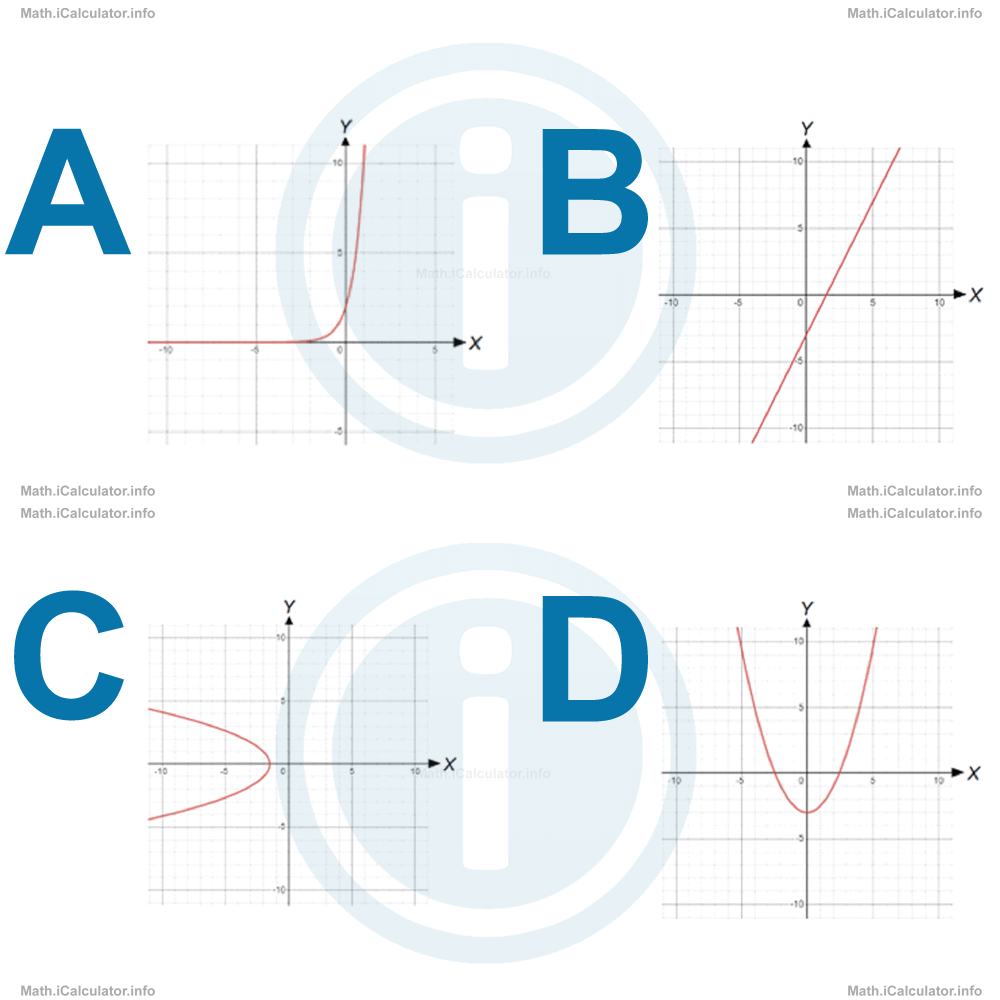
Correct Answer: C
3. . Which of the following exponential functions has a graph with an opposite orientation to the other three?
- y(x) = 2 · 5x
- y(x) = ½ · 4x
- y(x) = 3 · 2x
- y(x) = 4 · (1/2)x
Correct Answer: D
4. . What is the value of the coefficient k in the exponential function y(x) = k · ax shown by the graph below?
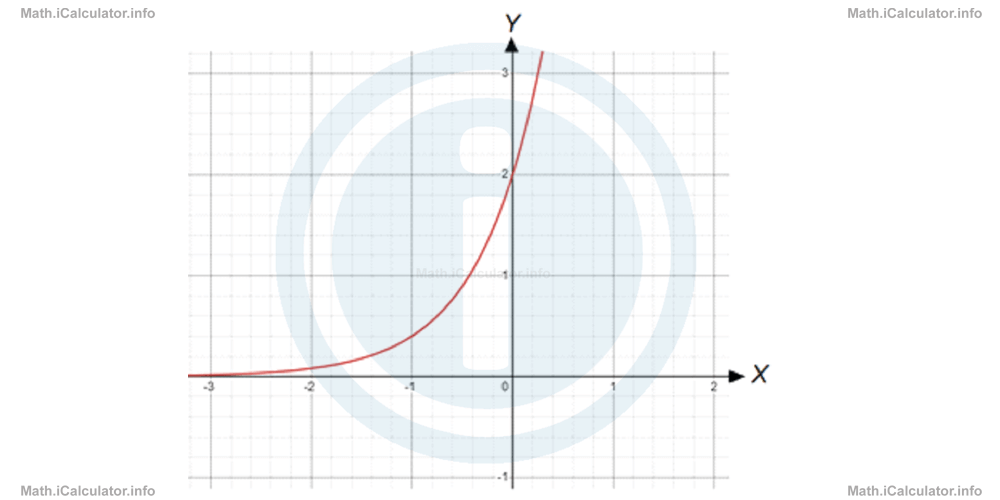
- 0
- 1
- 2
- 3
Correct Answer: C
5. . What is the base b of the function y(x) = k · bx shown in the figure below?
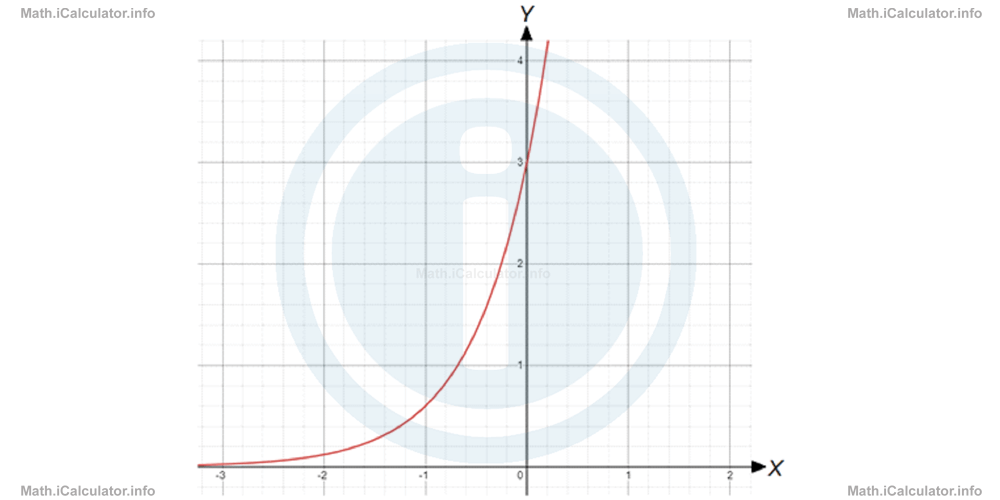
- 4
- 5
- 6
- 7
Correct Answer: B
6. . Which of the following graphs does NOT show a logarithmic function?
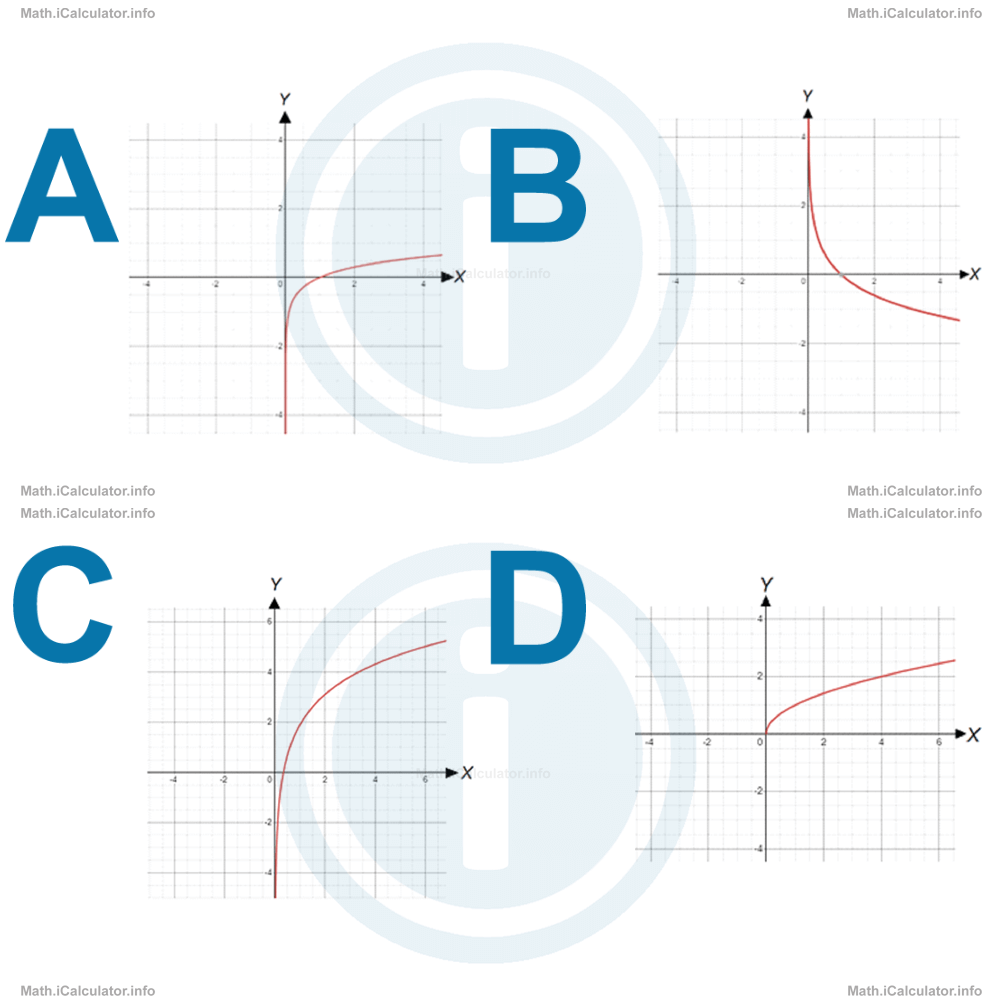
Correct Answer: D
7. . What is the logarithmic function indicated by the graph below?
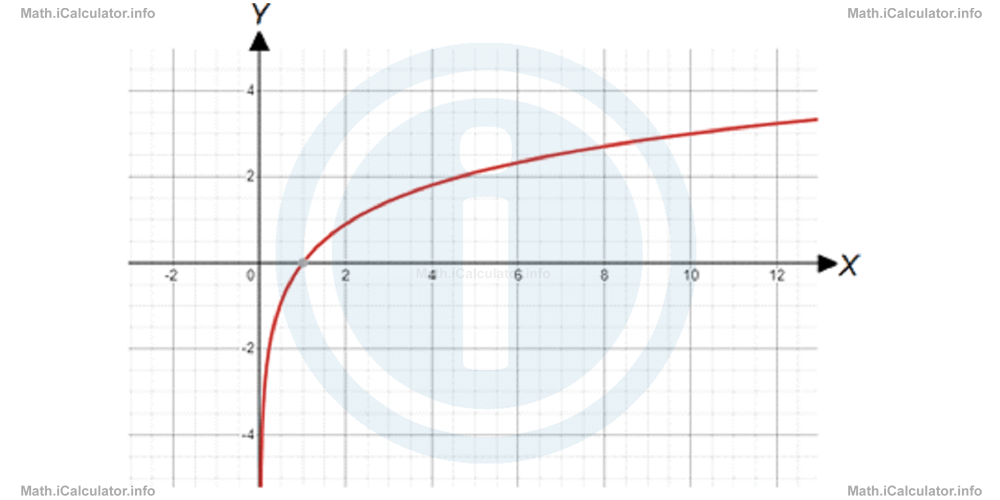
- y(x) = log x
- y(x) = log3 x
- y(x) = 3 log x
- y(x) = log (x/3)
Correct Answer: C
8. . What is the value of b for the logarithmic function y(x) = b · log x indicated by the graph below?
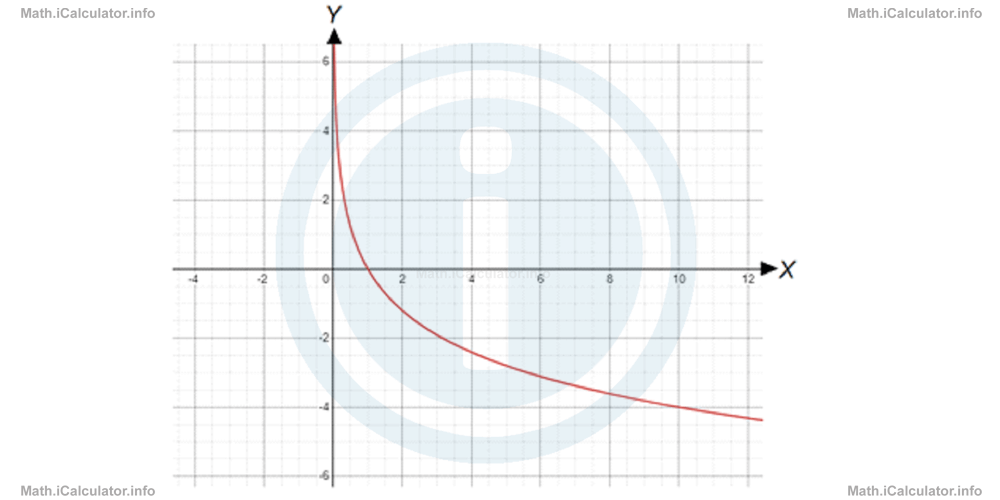
- -4
- -2
- 2
- 4
Correct Answer: A
9. . A modelled curve of the function y(x) = k · xn is shown in the graph below.
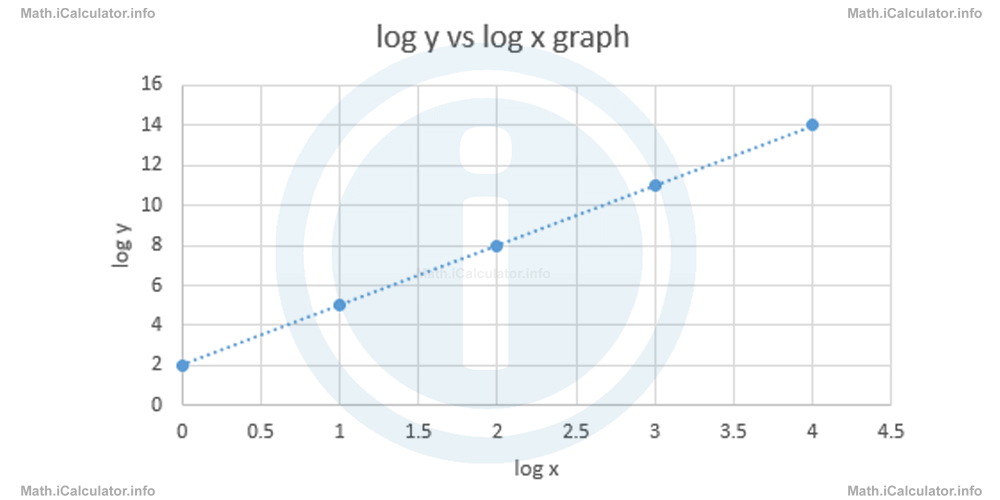
What is the value of the exponent n?
- 2
- 3
- 4
- 5
Correct Answer: B
10. . A modelled curve of the function y(x) = k · xn is shown in the graph below.
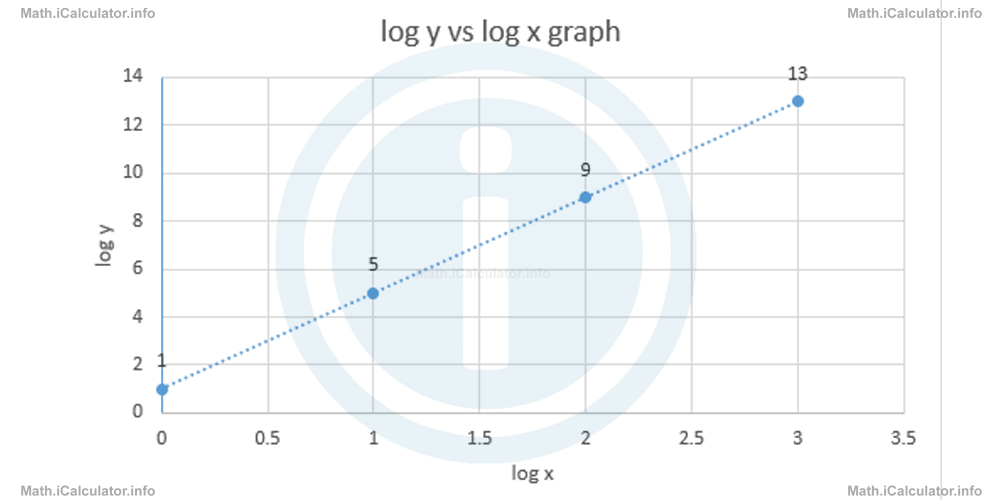
What is the value of the coefficient k?
- 1
- 2
- 5
- 9
Correct Answer: A
11. . Which of the following lines represent the function y(x) = 3x2 after modelling the curve?
- log y = log 3x + 2 log x
- log y = log 3 + 2 log x
- log y = log 3 + x log 2
- log y = log 3 + log x + log 2
Correct Answer: B
12. . Which of the following lines represent the function y(x) = 0.5 · 4x after modelling the curve?
- log y = log 2 + x log 4
- log y = x log 4 - log 2
- log y = log 0.5 + 4 log x
- log y = log 0.5 - x log 4
Correct Answer: B
13. . What is the equation of the line obtained after modelling the curve of the function shown by the data below?
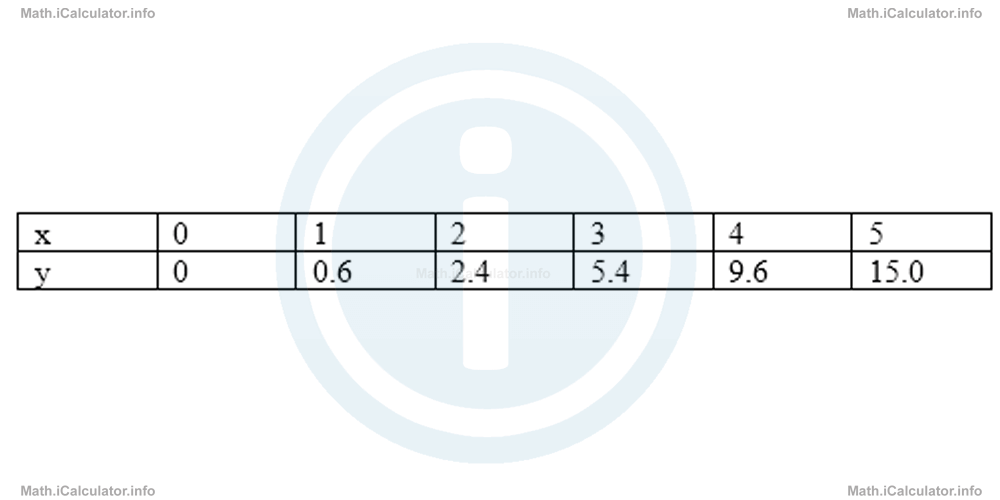
- y(x) = 0.6 x2
- log y = log 15 - 2 log x
- log y = 0.6 log x + log 2
- log y = 2 log x - log 6
Correct Answer: D
14. . What is the equation of the line obtained after modelling the curve of the function shown by the data below?
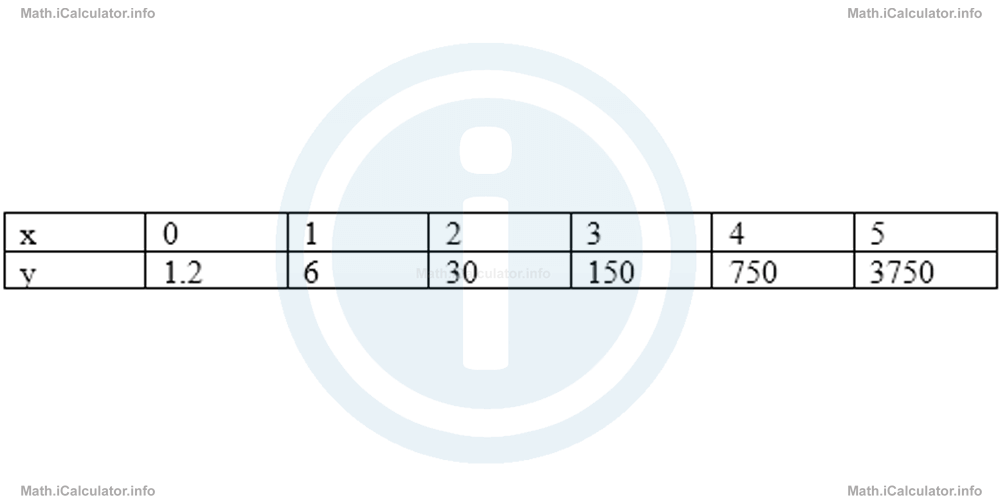
- y = 1.2 · 5x
- log y = log 1.2 + x · log 5
- y = 1.2 + 5x
- log y = log 1.2 + 5 log x
Correct Answer: B
15. . What is the original function shown by the table below used for modelling the curve?
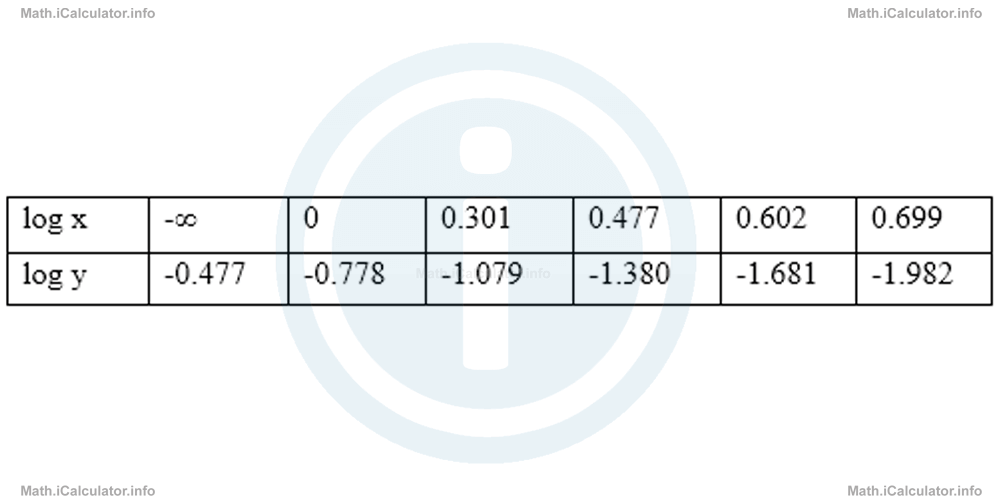
- y(x) = 3-2x
- y(x) = -3x-2
- y(x) = -3x2
- y(x) = -3 · 2x
Correct Answer: D
Whats next?
Enjoy the "Modelling Curves using Logarithms" practice questions? People who liked the "Modelling Curves using Logarithms" practice questions found the following resources useful:
- Practice Questions Feedback. Helps other - Leave a rating for this practice questions (see below)
- Logarithms Math tutorial: Modelling Curves using Logarithms. Read the Modelling Curves using Logarithms math tutorial and build your math knowledge of Logarithms
- Logarithms Video tutorial: Modelling Curves using Logarithms. Watch or listen to the Modelling Curves using Logarithms video tutorial, a useful way to help you revise when travelling to and from school/college
- Logarithms Revision Notes: Modelling Curves using Logarithms. Print the notes so you can revise the key points covered in the math tutorial for Modelling Curves using Logarithms
- Check your calculations for Logarithms questions with our excellent Logarithms calculators which contain full equations and calculations clearly displayed line by line. See the Logarithms Calculators by iCalculator™ below.
- Continuing learning logarithms - read our next math tutorial: Natural Logarithm Function and Its Graph
Help others Learning Math just like you
Please provide a rating, it takes seconds and helps us to keep this resource free for all to use
We hope you found this Math tutorial "Modelling Curves using Logarithms" useful. If you did it would be great if you could spare the time to rate this math tutorial (simply click on the number of stars that match your assessment of this math learning aide) and/or share on social media, this helps us identify popular tutorials and calculators and expand our free learning resources to support our users around the world have free access to expand their knowledge of math and other disciplines.