Menu
Math Questions 15.5 - Exponential Graphs
Please provide a rating, it takes seconds and helps us to keep this resource free for all to use
The following math revision questions are provided in support of the math tutorial on Exponential Graphs. In addition to this tutorial, we also provide revision notes, a video tutorial, revision questions on this page (which allow you to check your understanding of the topic and calculators which provide full, step by step calculations for each of the formula in the Exponential Graphs tutorials. The Exponential Graphs calculators are particularly useful for ensuring your step-by-step calculations are correct as well as ensuring your final result is accurate.
Not sure on some or part of the Exponential Graphs questions? Review the tutorials and learning material for Exponential Graphs
| Tutorial ID | Title | Tutorial | Video Tutorial | Revision Notes | Revision Questions |
|---|---|---|---|---|---|
| 15.5 | Exponential Graphs |
Exponential Graphs Revision Questions
Correct Answer: A
1. . Which of the following is NOT an exponential function?
- y(x) = x2 + e
- y(x) = ex/3
- y(x) = -0.32x + 5
- y(x) = 0.42x
Correct Answer: A
2. . Which is the parent function of y(x) = 42x + 5?
- y(x) = 42x + 5
- y(x) = 4x + 5
- y(x) = 22x
- y(x) = 4x
Correct Answer: D
3. . Which is TRUE about the exponential function y(x) = 3 · 52x + 1?
- The coefficient k is 1
- The function is decreasing
- The parent function is y(x) = 5
- The asymptote is y = 1
4. . What is the coefficient k in the function y(x) = 2 · 34x + 5 - 1 when expressed in the form
- 2
- 10
- 243
- 486
Correct Answer: D
5. . What is the y-intercept of the exponential function graph
- 1
- 4
- 5
- 13
Correct Answer: D
6. . What is the x-intercept of the exponential function graph
- -6
- -3
- 0
- 6
Correct Answer: B
7. . The figure below shows two exponential graphs A and B where A is the parent graph of B.
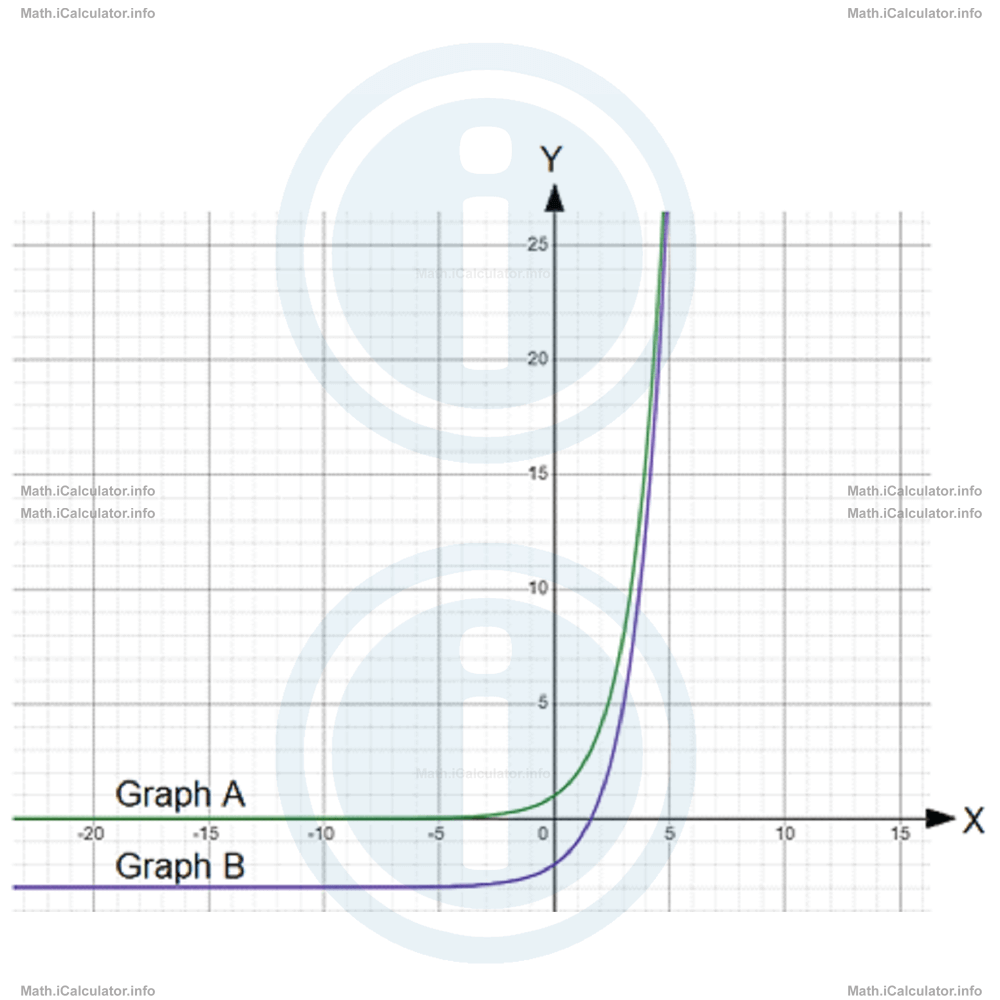
Which of the following is FALSE for the two functions A and B shown by the two lines in the graph?
- The asymptote of the function B is y = -3
- The k-coefficient of function A is 1
- The t-coefficient of the function B is -3
- The two graphs intercept at x = 5
Correct Answer: D
8. . What is the function shown in the graph below?
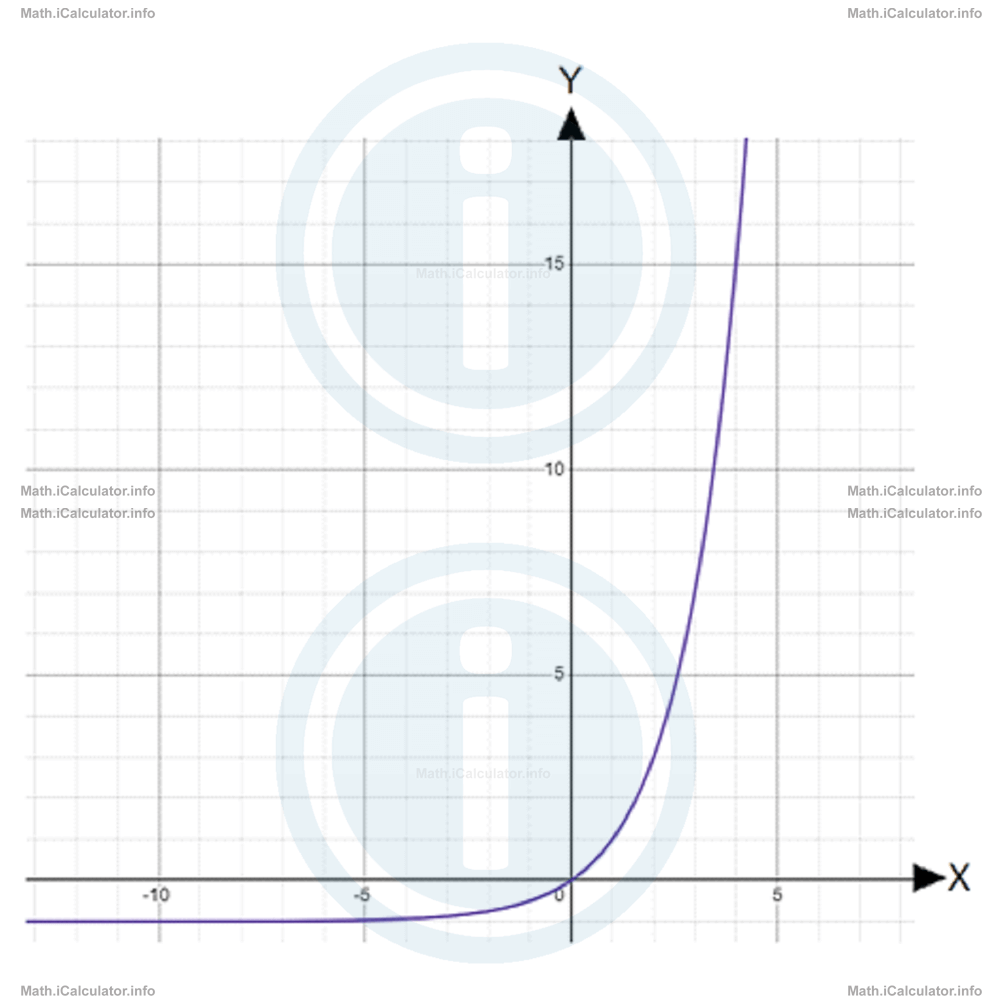
- y = 2x
- y = 3x
- y = 2x - 1
- y = 3x - 1
Correct Answer: C
9. . The graph below shows the function y = ax.
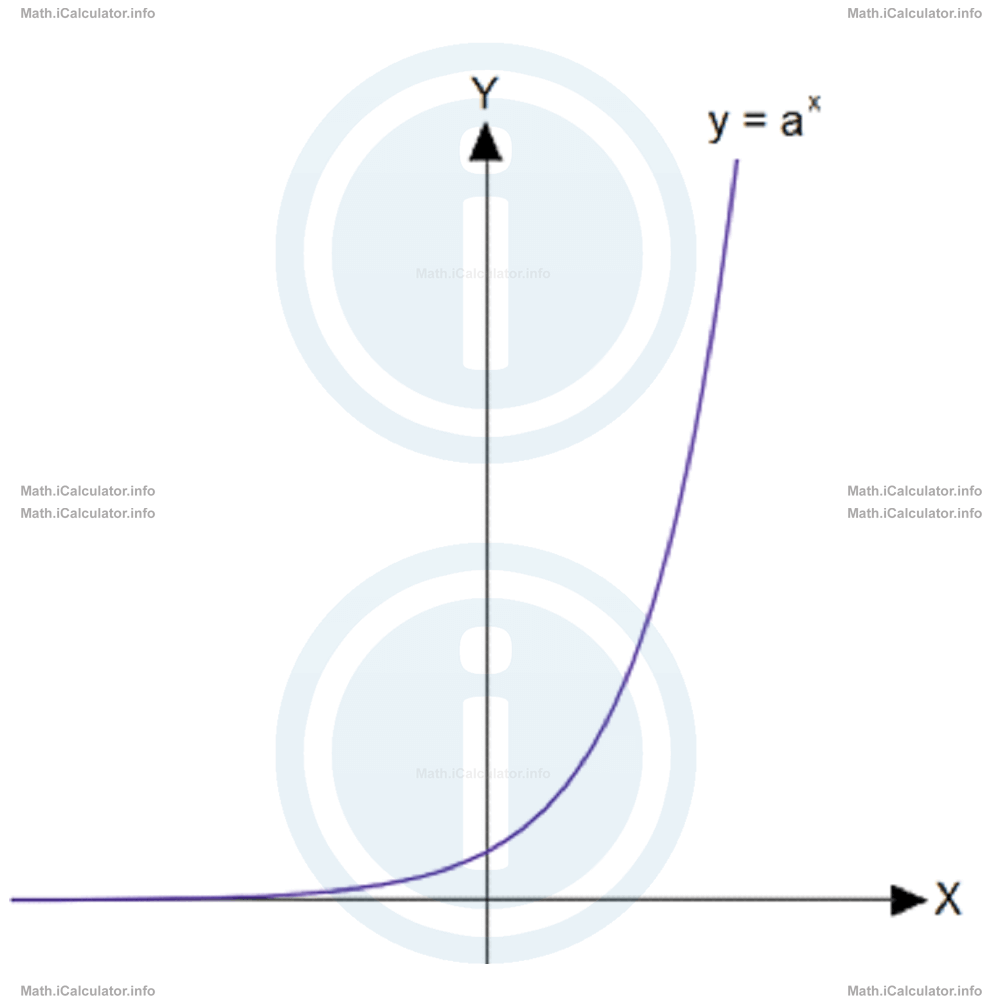
Which of the following graphs shows the function y(x) = (1/a)x?
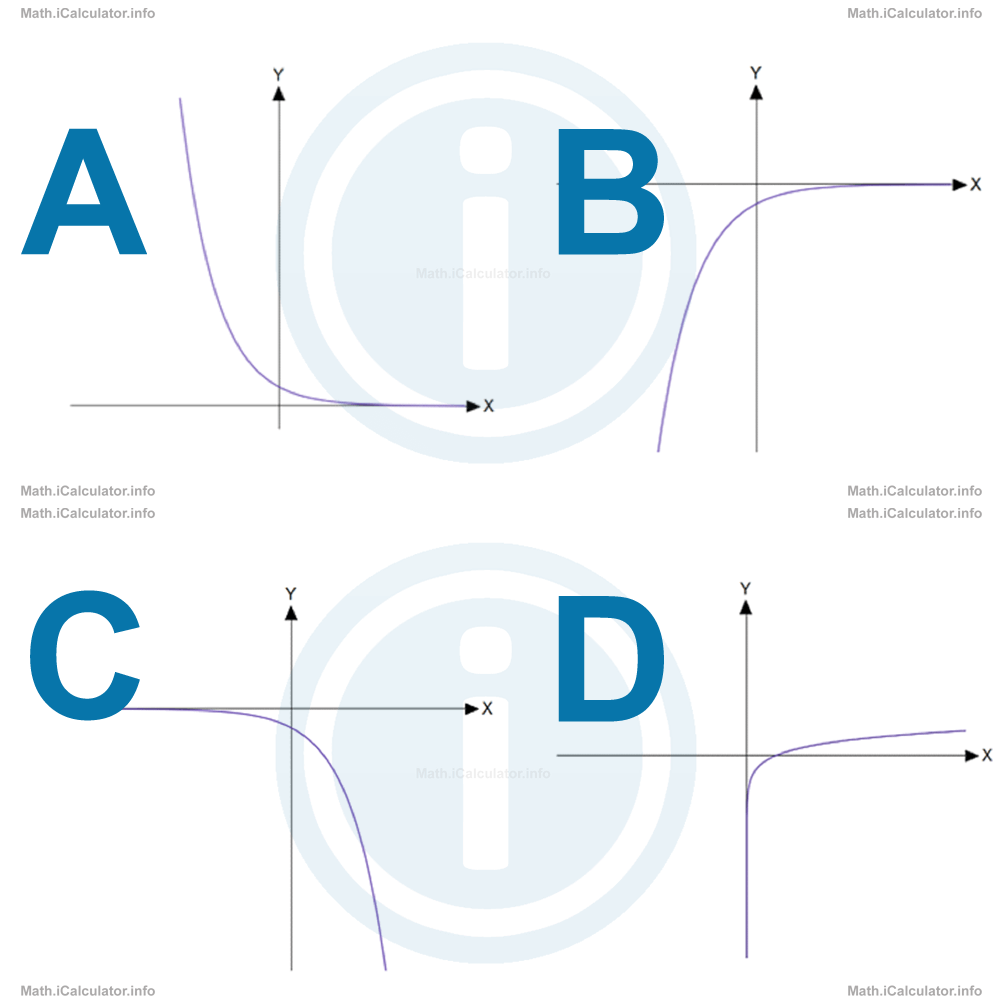
Correct Answer: A
10. . A radioactive sample taken by a soil contains 120 particles/mm3. The area becomes safe if the number of particles falls under 3 particles per mm3. Therefore, the local authorities decide to ban planting that soil until this is safe. The function that shows the number of decayed radioactive particles as a function of time in years is given by the following graph.
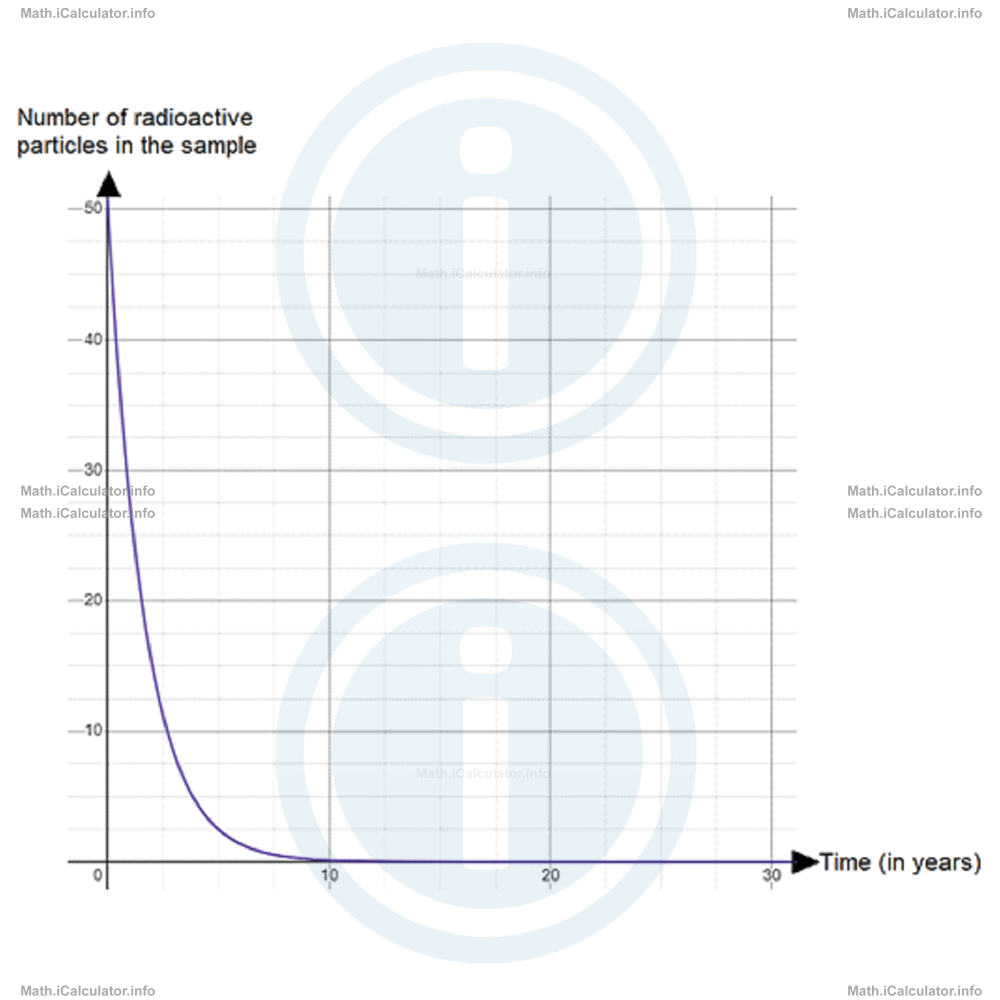
After how many years the local authorities will allow the farmers to plant the soil?
- After 1 year
- After 2.5 years
- After 5 years
- After 7.5 years
Correct Answer: B
Whats next?
Enjoy the "Exponential Graphs" practice questions? People who liked the "Exponential Graphs" practice questions found the following resources useful:
- Practice Questions Feedback. Helps other - Leave a rating for this practice questions (see below)
- Types of Graphs Math tutorial: Exponential Graphs. Read the Exponential Graphs math tutorial and build your math knowledge of Types of Graphs
- Types of Graphs Revision Notes: Exponential Graphs. Print the notes so you can revise the key points covered in the math tutorial for Exponential Graphs
- Check your calculations for Types of Graphs questions with our excellent Types of Graphs calculators which contain full equations and calculations clearly displayed line by line. See the Types of Graphs Calculators by iCalculator™ below.
- Continuing learning types of graphs - read our next math tutorial: Circle Graphs
Help others Learning Math just like you
Please provide a rating, it takes seconds and helps us to keep this resource free for all to use
We hope you found this Math tutorial "Exponential Graphs" useful. If you did it would be great if you could spare the time to rate this math tutorial (simply click on the number of stars that match your assessment of this math learning aide) and/or share on social media, this helps us identify popular tutorials and calculators and expand our free learning resources to support our users around the world have free access to expand their knowledge of math and other disciplines.