Menu
Math Lesson 15.4.2 - The Graph of a Reciprocal Function
Please provide a rating, it takes seconds and helps us to keep this resource free for all to use
Welcome to our Math lesson on The Graph of a Reciprocal Function, this is the second lesson of our suite of math lessons covering the topic of Reciprocal Graphs, you can find links to the other lessons within this tutorial and access additional Math learning resources below this lesson.
The Graph of a Reciprocal Function
When dealing with indirect proportion and variation in chapter 4, we have seen the shape of the graph obtained by expressing all values in a coordinates system. The graph was a curve that gets closer to the axes when the values of the variables represented through those axes increase more and more. In mathematical terms, this curve is called a hyperbola. The following figure shows a hyperbola produced by the function y = 1/x.
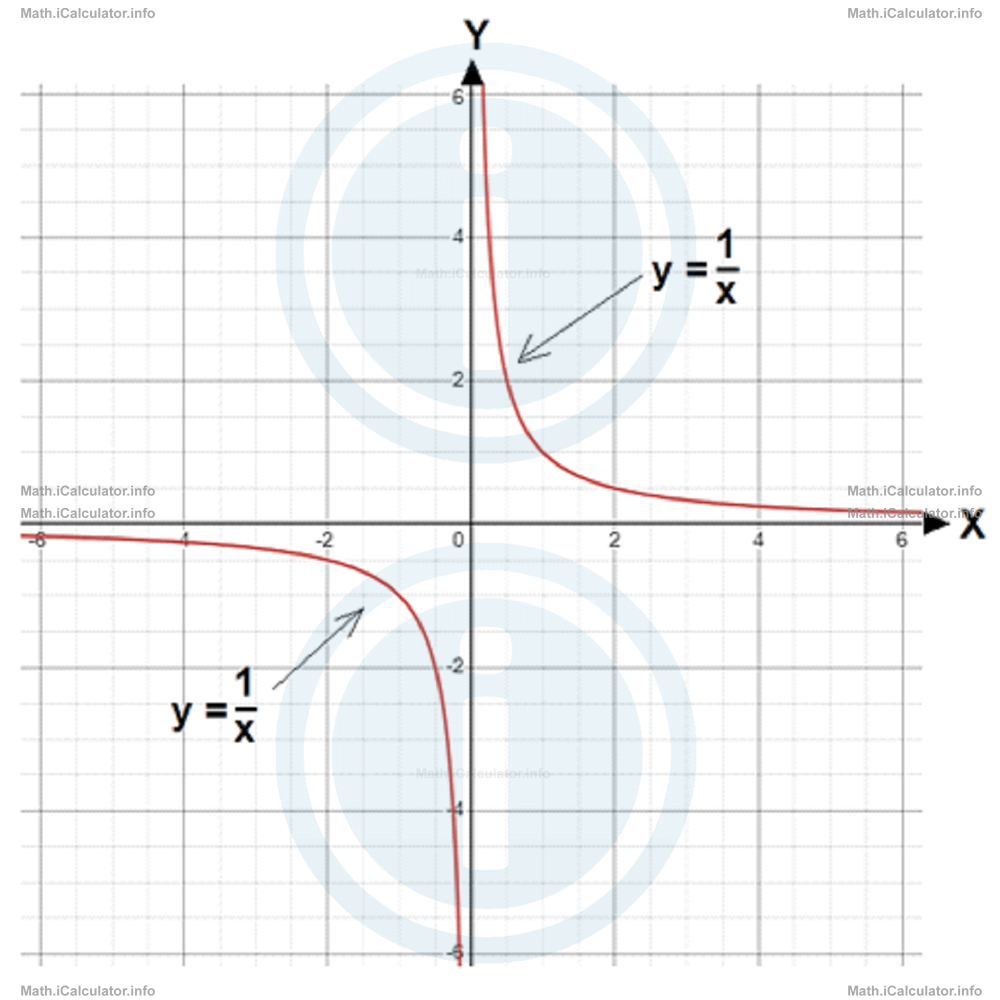
As you see, there is not a single but two hyperbolas that represent the graph of a reciprocal function appearing in a diagonal direction in respect to each other. One of the hyperbolas is for the positive values of the independent variable x (in the above example, it is in the first quadrant) and the other hyperbola is for the negative values of x.
The features of a hyperbola showing a reciprocal function are as follows:
- A hyperbola extends towards infinity in one direction but it approaches a fixed value in the other. For example, in the above figure, the first hyperbola (the rightmost one) extends to infinity on the right but it cannot be zero or negative on the left. Likewise, it extends to infinity upwards but cannot be zero or negative downwards.
- Lines of the form y = x + c act as lines of symmetry for the hyperbolas showing reciprocal functions. For example, the line y = x acts as a symmetry line for the hyperbola y = 1/x, as shown in the figure.
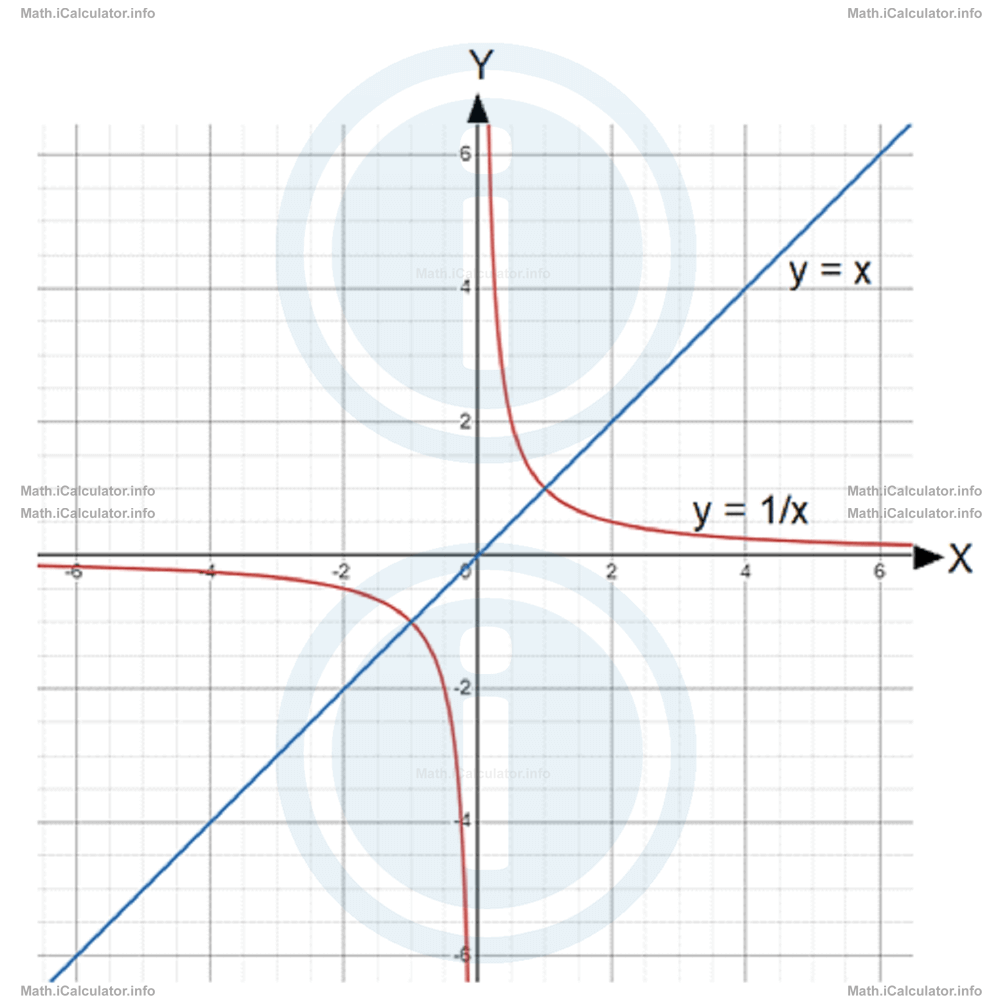
It is easy to see that the intercepts of the two above graphs are at (-1, -1) and (1, 1). They are obtained by solving the system of equations formed by the two lines representing each of the functions involved. Thus, solving the system of equations
with the substation method, we obtain by substituting the second equation to the first:
x2 = 1
x = √1
x1 = -1 and x2 = 1
Hence,
= 1/-1
= -1
and
= 1/1
= 1
We can plot a the graph of a reciprocal function by giving some values to the independent variable x (the bigger the number of values the more accurate the graph becomes) and then calculating the corresponding y-values using the function's formula. The x-values must be both positive and negative, as the hyperbola has two parts. Let's see an example.
Example 5
Plot the graph of the function
Solution 5
Let's make a table with some x-values in it so that the corresponding y-values are to be calculated. We have
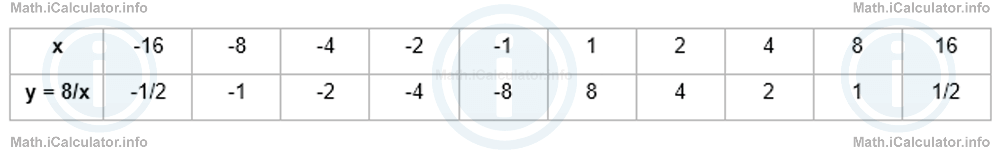
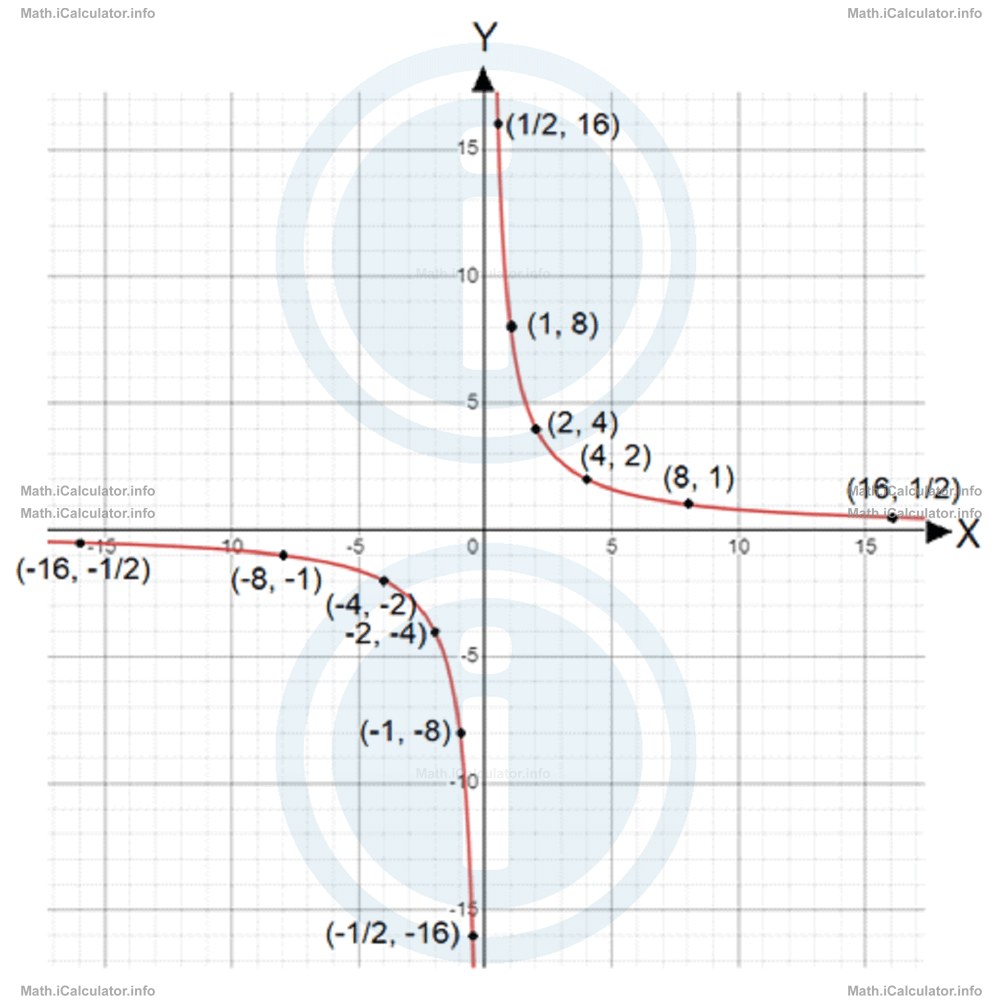
Each column represents the coordinates of a single point of the graph where the upper number shows the x-value while the bottom number shows the corresponding y-value of the same point. Inserting all these points into the coordinates system and connecting them smoothly gives the graph shown below.
You have reached the end of Math lesson 15.4.2 The Graph of a Reciprocal Function. There are 5 lessons in this physics tutorial covering Reciprocal Graphs, you can access all the lessons from this tutorial below.
More Reciprocal Graphs Lessons and Learning Resources
Whats next?
Enjoy the "The Graph of a Reciprocal Function" math lesson? People who liked the "Reciprocal Graphs lesson found the following resources useful:
- Graph Feedback. Helps other - Leave a rating for this graph (see below)
- Types of Graphs Math tutorial: Reciprocal Graphs. Read the Reciprocal Graphs math tutorial and build your math knowledge of Types of Graphs
- Types of Graphs Revision Notes: Reciprocal Graphs. Print the notes so you can revise the key points covered in the math tutorial for Reciprocal Graphs
- Types of Graphs Practice Questions: Reciprocal Graphs. Test and improve your knowledge of Reciprocal Graphs with example questins and answers
- Check your calculations for Types of Graphs questions with our excellent Types of Graphs calculators which contain full equations and calculations clearly displayed line by line. See the Types of Graphs Calculators by iCalculator™ below.
- Continuing learning types of graphs - read our next math tutorial: Exponential Graphs
Help others Learning Math just like you
Please provide a rating, it takes seconds and helps us to keep this resource free for all to use
We hope you found this Math tutorial "Reciprocal Graphs" useful. If you did it would be great if you could spare the time to rate this math tutorial (simply click on the number of stars that match your assessment of this math learning aide) and/or share on social media, this helps us identify popular tutorials and calculators and expand our free learning resources to support our users around the world have free access to expand their knowledge of math and other disciplines.