Menu
Math Lesson 14.1.2 - Horizontal Linear Graphs
Please provide a rating, it takes seconds and helps us to keep this resource free for all to use
Welcome to our Math lesson on Horizontal Linear Graphs, this is the second lesson of our suite of math lessons covering the topic of Linear Graphs, you can find links to the other lessons within this tutorial and access additional Math learning resources below this lesson.
Horizontal Linear Graphs
If a linear graph is horizontal, this means that the y-coordinate does not change. This means that all points of the graph have the same y-coordinate for whatever value of x. In this way, we don't need an x-coordinate in horizontal graphs; the only important information in such graphs is their y-coordinate, which shows how above or below the horizontal axis the graph of the line lies. The figure below shows three horizontal graphs: y = 3, y = 0 and y = -4.
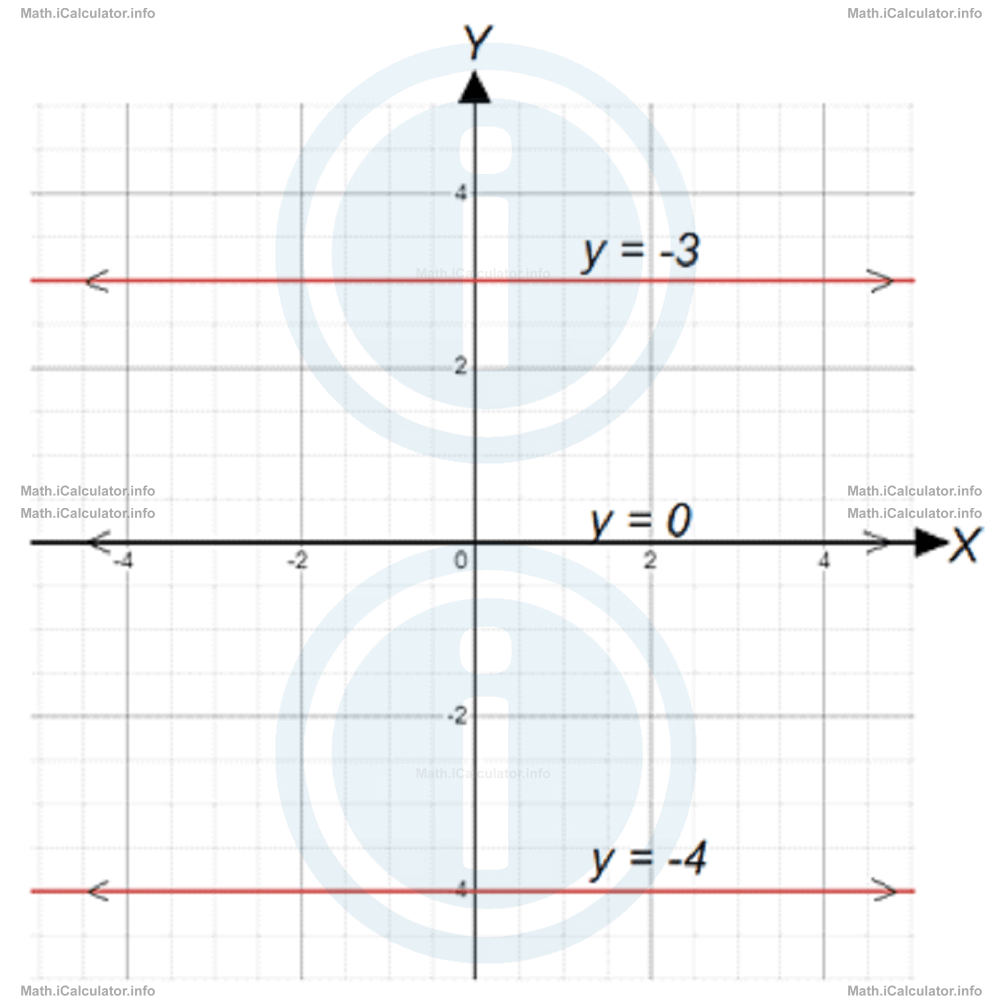
The double arrows indicate that all lines are unlimited on both sides.
From the math lessons in chapter 9 we know that the general equation of horizontal lines (in a 2-D figure) is
where a and b are coefficients and c is a constant. In this specific case the independent variable is not necessary in the equation so we can hide it from view. This is achieved by making the coefficient a preceding the variable x zero. Thus, first we obtain
and after a further simplification (by removing the 0x term as all numbers multiplied by zero equa zero) we obtain the simplest form of the equation of horizontal graphs
Solving it for the variable y yields
y = -c/b
The above value indicates the vertical position (quote) of the graph with respect to the horizontal axis - an axis that acts as a ground-level (or as a reference position or origin). Thus, if y is positive the graph is above the origin, if y = 0 the graph lies according to the origin represented by the X-axis and if y < 0, the graph lies below the origin, as shown in the figure above.
Example 1
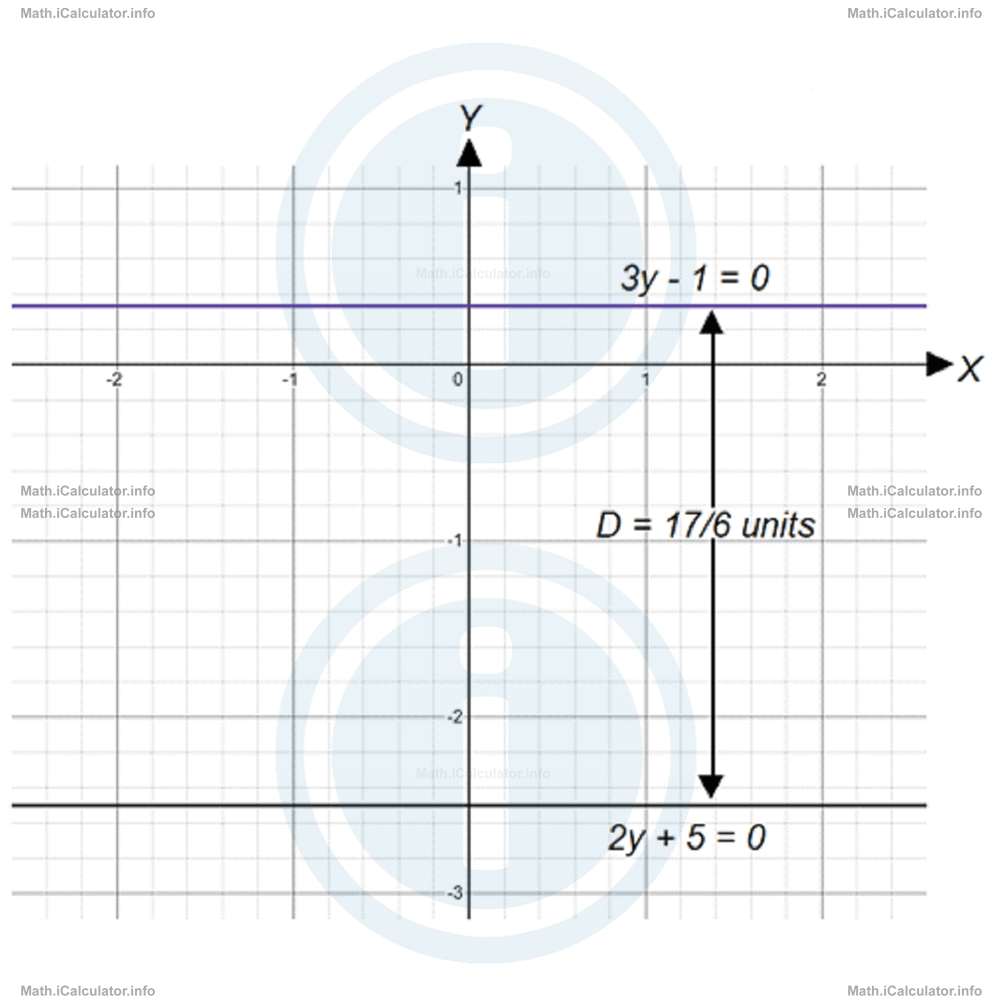
- What is the distance between the lines 3y - 1 = 0 and 2y + 5 = 0?
- Make a figure that shows both of these lines.
Solution 1
- We start by finding the values of y for each line. Thus, for the first line we have 3y-1 = 0and for the second function we have
3y = 1
y = 1/32y + 5 = 0These results mean that the first graph is 1/3 units above the origin and the second graph is 5/2 units below the origin. Since they are on the opposite sides of the horizontal axis, we must add these two numbers (without considering the sign) to find the distance between the given lines. Hence, the required distance D is
2y = -5
y = -5/2D = 1/3 + 5/2
= 2/6 + 15/6
= 17/6 units - The figure that includes both lines is shown below.
More Linear Graphs Lessons and Learning Resources
Whats next?
Enjoy the "Horizontal Linear Graphs" math lesson? People who liked the "Linear Graphs lesson found the following resources useful:
- Horizontal Feedback. Helps other - Leave a rating for this horizontal (see below)
- Linear Graphs Math tutorial: Linear Graphs. Read the Linear Graphs math tutorial and build your math knowledge of Linear Graphs
- Linear Graphs Revision Notes: Linear Graphs. Print the notes so you can revise the key points covered in the math tutorial for Linear Graphs
- Linear Graphs Practice Questions: Linear Graphs. Test and improve your knowledge of Linear Graphs with example questins and answers
- Check your calculations for Linear Graphs questions with our excellent Linear Graphs calculators which contain full equations and calculations clearly displayed line by line. See the Linear Graphs Calculators by iCalculator™ below.
- Continuing learning linear graphs - read our next math tutorial: Slopes and Gradients
Help others Learning Math just like you
Please provide a rating, it takes seconds and helps us to keep this resource free for all to use
We hope you found this Math tutorial "Linear Graphs" useful. If you did it would be great if you could spare the time to rate this math tutorial (simply click on the number of stars that match your assessment of this math learning aide) and/or share on social media, this helps us identify popular tutorials and calculators and expand our free learning resources to support our users around the world have free access to expand their knowledge of math and other disciplines.