Menu
Math Lesson 14.1.5 - Plotting Linear Graphs that have a Limited Range
Please provide a rating, it takes seconds and helps us to keep this resource free for all to use
Welcome to our Math lesson on Plotting Linear Graphs that have a Limited Range, this is the fifth lesson of our suite of math lessons covering the topic of Linear Graphs, you can find links to the other lessons within this tutorial and access additional Math learning resources below this lesson.
Plotting Linear Graphs that have a Limited Range
At this point we have to assume knowledge of two important concepts that will be explained in more detail in the "Functions" chapter. These are the concepts of domain and range. The domain is the set of all possible values the independent variable x can take, whereas the range is the set of the corresponding y-values of the dependent variable. In other words, if the domain is limited within a certain region of the X-axis, this usually brings a limitation of the graph's line, which in return causes some limitation in the corresponding y-values as well.
In all examples considered so far, we have not mentioned any limitation in the variables' values, so the domain and range have both been from the set of real numbers R. Now, we will see what happens with a linear graph in situations where the domain has some restrictions.
Let's consider a linear graph that is limited on both sides. If we denote the points that represent the endpoints of a limited linear graph as A and B, where A is the leftmost point, then the procedure followed to plot the graph if only the two limit values of the independent variable x are known, is as follows:
Step 1: Substitute the two limit values xA and xB in the line's equation. In this way, you will obtain the two corresponding y-values of the limit points A and B.
Step 2: Connect these points in the shortest way (in a straight line) to plot the graph.
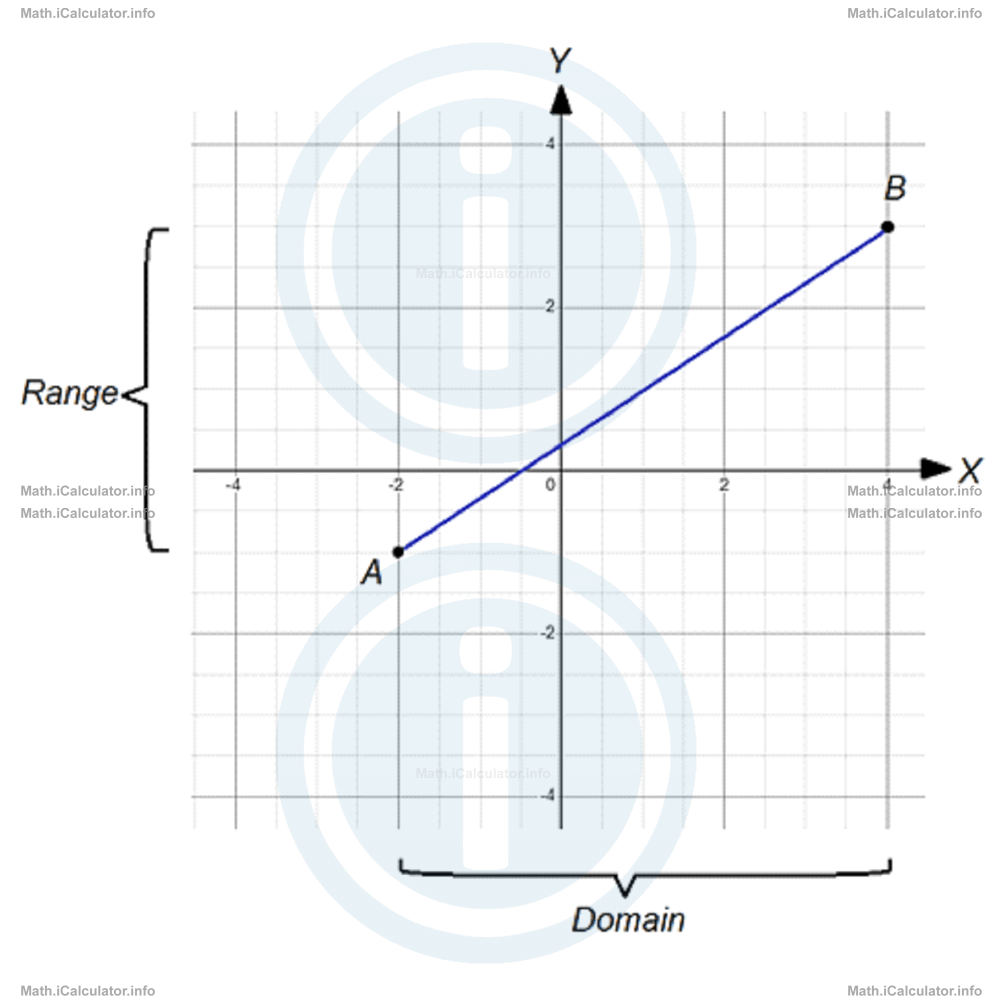
For example, if we have the linear equation 2x - 3y + 1 = 0 limited within the points A and B where the domain is [-2, 4], the corresponding y-values that give the range of this line (for xA = -2 and xB = 4) are
2 ∙ (-2) - 3 ∙ yA + 1 = 0
-4 - 3 ∙ yA + 1 = 0
-3 ∙ yA-3 = 0
-3 ∙ yA = 3
yA = 3/-3
yA = -1
and
2 ∙ 4 - 3 ∙ yB + 1 = 0
8 - 3 ∙ yB + 1 = 0
-3 ∙ yB + 9 = 0
-3 ∙ yA = -9
yB = -9/-3
yB = 3
Therefore, points A(-2, -1) and B(4, 3) are the limit points (endpoints) of the graph.
Another thing we discovered here is the range of the line, i.e. the set of vertical values it lies, represented by the segment [1, 3]. The interpretation of all the above findings is as follows:
The line extends horizontally between the coordinates x = -2 and x = 4 but not on the left of x = -2 and on the right of x = 4. On the other hand, the line extends vertically between the coordinates y = -1 and y = 3 but not below y = -1 and above y = 3.
The graph of the line is shown in the figure below.
When plotting a linear graph with a limited domain and range (but not only), we make use of one of the main line's properties, which says that two points determine a single line. That's why it is sufficient to have just two points of a linear function in order to plot its graph. To avoid unnecessary operations, we choose these two values to be the limit values, which determine the domain and range of a linear function.
Example 4
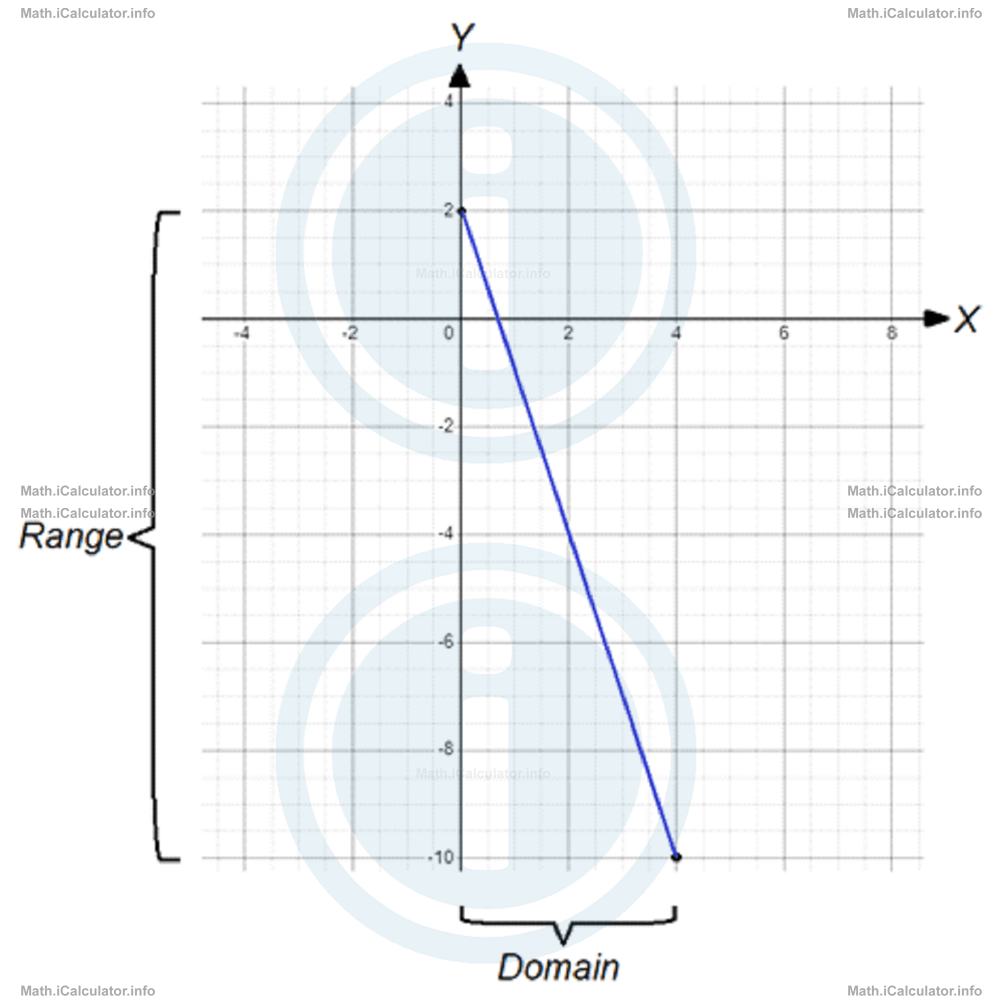
Plot the linear graph 3x + y - 2 = 0 limited to four units only in the horizontal direction by starting from the origin and moving due right (including the endpoints as well).
Solution 4
From the equation given in the clues, it is clear that we are dealing with a linear equation/function/graph. From clues, it is clear that the domain of the given line is the segment [0, 4]. Therefore, to plot the graph of this line it is sufficient to find the coordinates of the endpoints. Thus, denoting the endpoints by A and B - where A is the leftmost one - yields
Therefore, for the corresponding y-values of the endpoints we obtain
3 ∙ 0 + yA - 2 = 0
yA - 2 = 0
yA = 2
and
3 ∙ 4 + yB - 2 = 0
12 + yB - 2 = 0
yB + 10 = 0
yB = -10
Therefore, we have for the given line the following data:
Range R = [2, -10]
Endpoints: A(0, 2) and B(4, -10)
Therefore, the graph that represents this line in the XY coordinate system is shown below.
More Linear Graphs Lessons and Learning Resources
Whats next?
Enjoy the "Plotting Linear Graphs that have a Limited Range" math lesson? People who liked the "Linear Graphs lesson found the following resources useful:
- Plotting Feedback. Helps other - Leave a rating for this plotting (see below)
- Linear Graphs Math tutorial: Linear Graphs. Read the Linear Graphs math tutorial and build your math knowledge of Linear Graphs
- Linear Graphs Revision Notes: Linear Graphs. Print the notes so you can revise the key points covered in the math tutorial for Linear Graphs
- Linear Graphs Practice Questions: Linear Graphs. Test and improve your knowledge of Linear Graphs with example questins and answers
- Check your calculations for Linear Graphs questions with our excellent Linear Graphs calculators which contain full equations and calculations clearly displayed line by line. See the Linear Graphs Calculators by iCalculator™ below.
- Continuing learning linear graphs - read our next math tutorial: Slopes and Gradients
Help others Learning Math just like you
Please provide a rating, it takes seconds and helps us to keep this resource free for all to use
We hope you found this Math tutorial "Linear Graphs" useful. If you did it would be great if you could spare the time to rate this math tutorial (simply click on the number of stars that match your assessment of this math learning aide) and/or share on social media, this helps us identify popular tutorials and calculators and expand our free learning resources to support our users around the world have free access to expand their knowledge of math and other disciplines.