Menu
Math Lesson 15.1.3 - Is there an easy way to plot a Quadratic Graph?
Please provide a rating, it takes seconds and helps us to keep this resource free for all to use
Welcome to our Math lesson on Is there an easy way to plot a Quadratic Graph?, this is the third lesson of our suite of math lessons covering the topic of Quadratic Graphs Part One, you can find links to the other lessons within this tutorial and access additional Math learning resources below this lesson.
Is there an easy way to plot a Quadratic Graph?
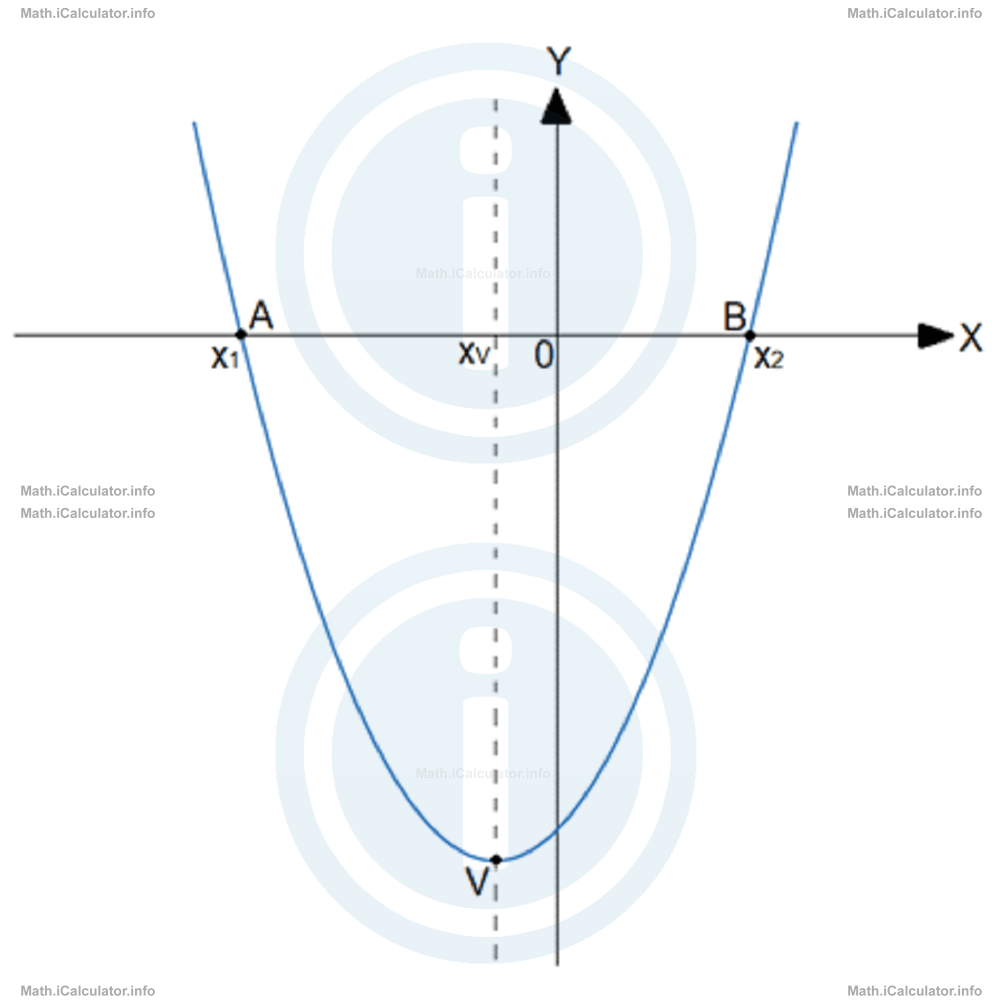
The best thing to do when trying to sketch a quadratic graph is to find some special points of the graph that allow you to visualise the width, direction and minimum/maximum position of the curve. We will know explain these special points and how to find them.
- The x-intercept(s), if any. You can find these points by substituting y = 0 in the equation y = ax2 + bx + cto obtain the corresponding quadratic equation with a single variable, this is a special case of the quadratic equation with two variables. This special equation has the general formax2 + bx + c = 0Then, if you are lucky and the discriminant is positive, you obtain two points of the graph, which correspond to the x-intercepts. They are A(x1, 0) and B(x2, 0), where x1 and x2 are the solutions of the above quadratic equation with one variable. These solutions (we also call them "roots") are calculated by the formulasx1 = -b - √∆/2a and x2 = -b + √∆/2aas described in the first paragraph of this tutorial. Therefore, since the coordinates of points A and B are A(x1, 0) and B(x2, 0) respectively, we obtainA(-b - √∆/2a,0) and B(-b + √∆/2a,0)
- The vertex point V. Given that the graph is symmetrical when "folded" laterally according to the vertical line that passes through vertex V, we obtain two identical halves of the parabola. When doing this, the two x-intercepts also coincide. Therefore, we can use the half-segment formula explained in the previous tutorial to find the x-coordinate of vertex V. This is because the x-coordinate of the vertex coincides with the half-segment point of the segment AB.
 From the half-segment formula for the x-direction, we therefore obtain xV = xA + xB/2Given thatxA = x1 = -b - √∆/2aandxB = x2 = -b + √∆/2awe obtainxV = 1/2 ∙ (-b - √∆/2a + -b + √∆/2a)Substituting this value obtained for x in the original equation
= -b - √∆ - b + √∆/4a
= -2b/4a
= -b/2ay = ax2 + bx + cyields for the vertical coordinate of the vertex V:yV = a ∙ (-b/2a)2 + b ∙ (-b/2a) + cTherefore, the coordinates of the vertex V are
= a ∙ b2/4a2 - b2/2a + c
= b2/4a - b2/2a + c
= b2/4a - 2b2/4a + c
= -b2/4a + c
= -b2/4a + 4ac/4a
= -b2 + 4ac/4a
= -(b2 - 4ac)/4a
= -∆/4aV(-b/2a, -∆/4a) - Another point of the parabola that is easy to find is the y-intercept. Since the x-coordinate of any y-intercept is always zero, we can solve the original quadratic equation for x = 0. In this way, we obtain y = c. Therefore the coordinates of the y-intercept (say point C) are C(0, c).
- Optional! You can also find the symmetrical point to the y-intercept to obtain a kind of symmetry in the points and therefore make the graph more accurate. For this, we again use the half-segment formula, where xV is the half-segment point, x = 0 is one of the endpoints and the other endpoint has to be found. In this case, we need to find only the x-coordinate of this new point (say D), as the y-coordinate is the same as that of point C (because of the symmetry). This will be clearer after solving the example below.
Using these 5 points, you can plot a quadratic graph with a satisfactory level of accuracy. Look at the following example.
Example 1
Plot the graph of the quadratic equation
Solution 1
We have a = 1, b = -5 and c = 4. The discriminant Δ therefore is
= (-5)2 - 4 ∙ 1 ∙ 4
= 25 - 16
= 9
Since the discriminant is positive, the equation
has two distinct roots, so the parabola produced by the original quadratic equation has two x-intercepts: xA and xB. They are:
= -(-5) - √9/2 ∙ 1
= 5 - 3/2
= 2/2
= 1
and
= -(-5) + √9/2 ∙ 1
= 5 + 3/2
= 8/2
= 4
The corresponding y-values for points A and B are zero, as they are x-intercepts. Therefore, we obtain the first two points of the graph:
Now, let's find the coordinates of the vertex V of the parabola. We have
= -(-5)/2 ∙ 1
= 5/2
and
= -9/4 ∙ 1
= -9/4
Therefore, the third point of the graph is
Next, let's find the coordinates of the fourth point of the graph, i.e. of point C, which is the point where the parabola intercepts the y-axis. Thus, for x = 0, we have y = c. Given that c = 4, the coordinates of point C are: C(0, 4).
Last, let's find the coordinates of point D, which is symmetrical with point C in respect to the vertical line drawn from point V. Applying the formula of the segment midpoint (here the midpoint is xV),
for the horizontal direction only, we obtain after the substitutions:
xD = 5
The corresponding y-value of point D therefore is
= 25 - 25 + 4
= 4
Hence, the fifth point of the graph is D(5, 4).
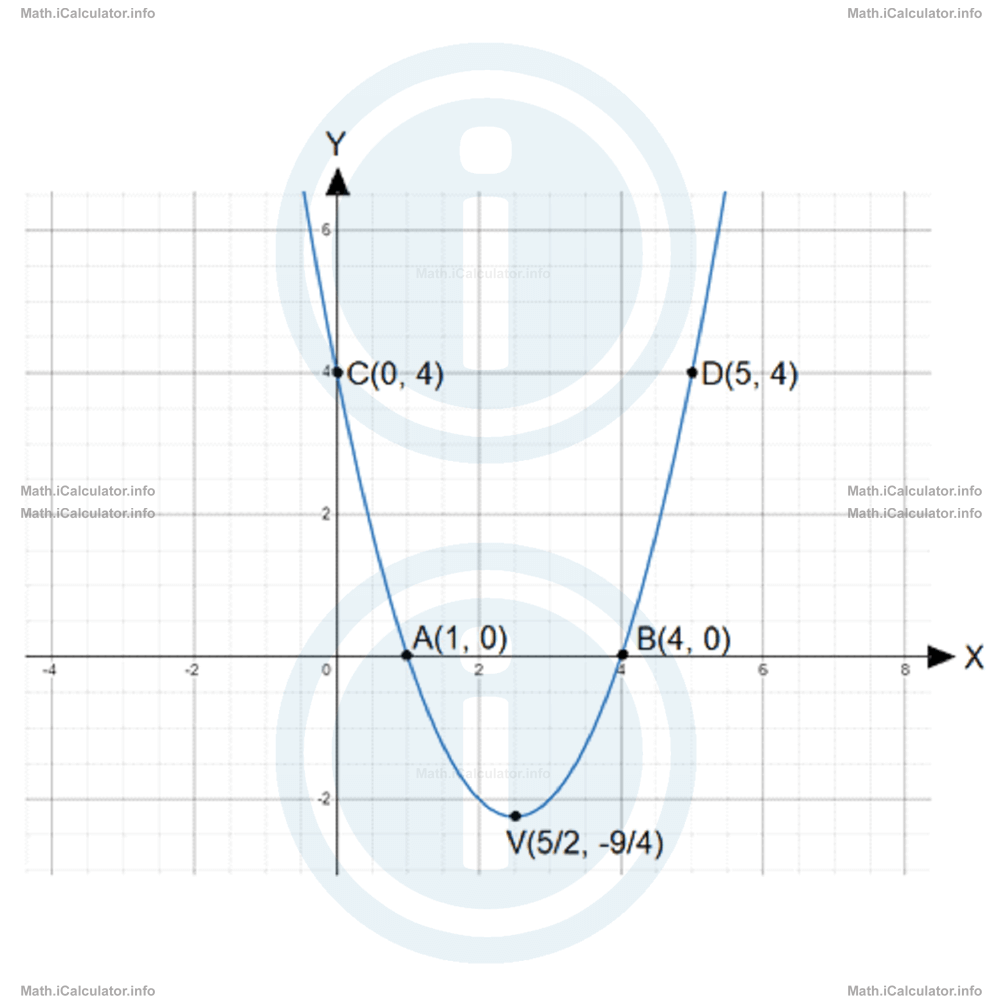
Now, let's insert all the above points into the coordinate system. We have
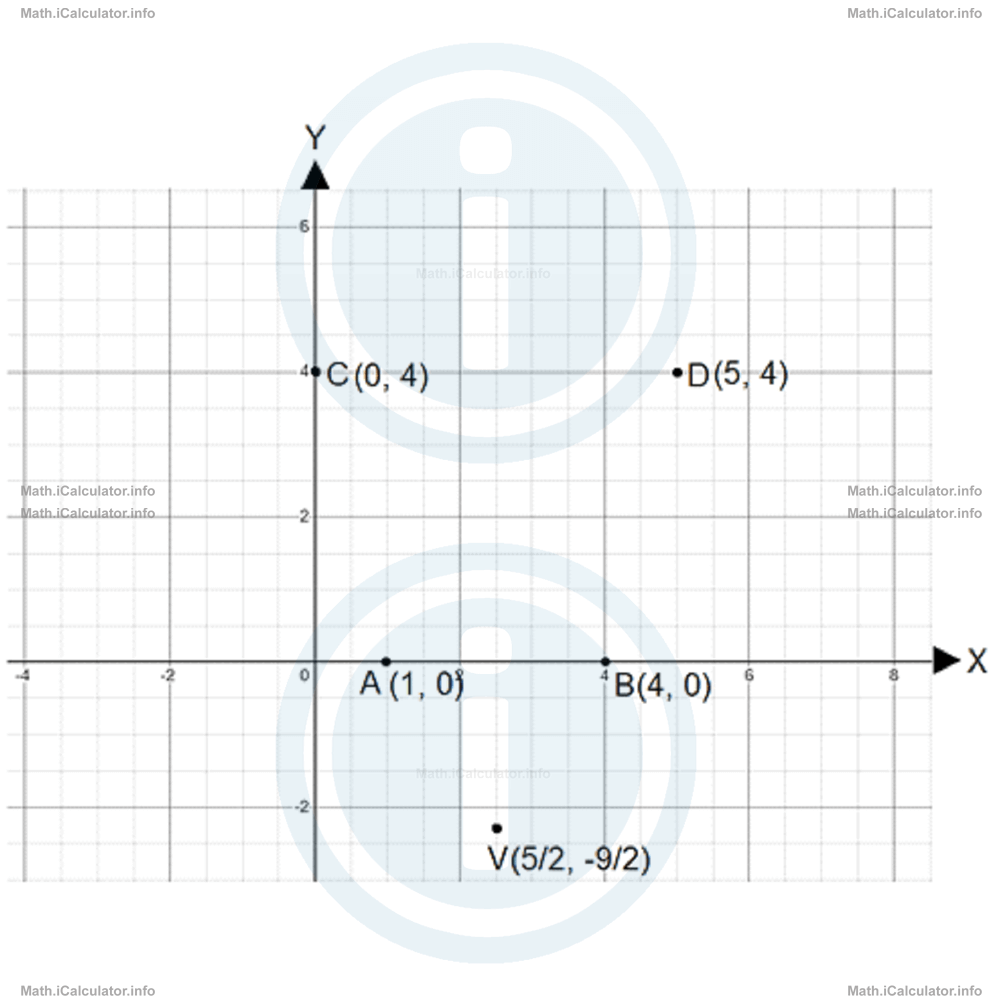
Connecting these points smoothly and continuing in that way in both directions yields the following graph:
You have reached the end of Math lesson 15.1.3 Is there an easy way to plot a Quadratic Graph?. There are 6 lessons in this physics tutorial covering Quadratic Graphs Part One, you can access all the lessons from this tutorial below.
More Quadratic Graphs Part One Lessons and Learning Resources
Whats next?
Enjoy the "Is there an easy way to plot a Quadratic Graph?" math lesson? People who liked the "Quadratic Graphs Part One lesson found the following resources useful:
- Graph Feedback. Helps other - Leave a rating for this graph (see below)
- Types of Graphs Math tutorial: Quadratic Graphs Part One. Read the Quadratic Graphs Part One math tutorial and build your math knowledge of Types of Graphs
- Types of Graphs Revision Notes: Quadratic Graphs Part One. Print the notes so you can revise the key points covered in the math tutorial for Quadratic Graphs Part One
- Types of Graphs Practice Questions: Quadratic Graphs Part One. Test and improve your knowledge of Quadratic Graphs Part One with example questins and answers
- Check your calculations for Types of Graphs questions with our excellent Types of Graphs calculators which contain full equations and calculations clearly displayed line by line. See the Types of Graphs Calculators by iCalculator™ below.
- Continuing learning types of graphs - read our next math tutorial: Quadratic Graphs Part Two
Help others Learning Math just like you
Please provide a rating, it takes seconds and helps us to keep this resource free for all to use
We hope you found this Math tutorial "Quadratic Graphs Part One" useful. If you did it would be great if you could spare the time to rate this math tutorial (simply click on the number of stars that match your assessment of this math learning aide) and/or share on social media, this helps us identify popular tutorials and calculators and expand our free learning resources to support our users around the world have free access to expand their knowledge of math and other disciplines.