Menu
Math Lesson 16.2.5 - The Graph of a Function
Please provide a rating, it takes seconds and helps us to keep this resource free for all to use
Welcome to our Math lesson on The Graph of a Function, this is the fifth lesson of our suite of math lessons covering the topic of Injective, Surjective and Bijective Functions. Graphs of Functions, you can find links to the other lessons within this tutorial and access additional Math learning resources below this lesson.
The Graph of a Function
In the previous tutorials, we have often dealt with the graphs of functions. It is a geometrical representation of the set of all points (ordered pairs) which - when substituted in the function's formula - make this function true.
In general, for every numerical function f: X → R, the graph is composed of an infinite set of real ordered pairs (x, y), where x ∊ R and y ∊ R. Every such ordered pair has in correspondence a single point in the coordinates system XOY, where the first number of the ordered pair corresponds to the x-coordinate (abscissa) of the graph while the second number corresponds to the y-coordinate (ordinate) of the graph in that point.
The graph below has five points A, B, C, D and E highlighted. Each of these points represents an ordered pair (x, y). Looking at closer, we identify the two coordinates (abscissa and ordinate) of each of these points as follows: A(-1, 5/2), B(0, 0), C(2, -2), D(4, 0) and E(5, 5/2).
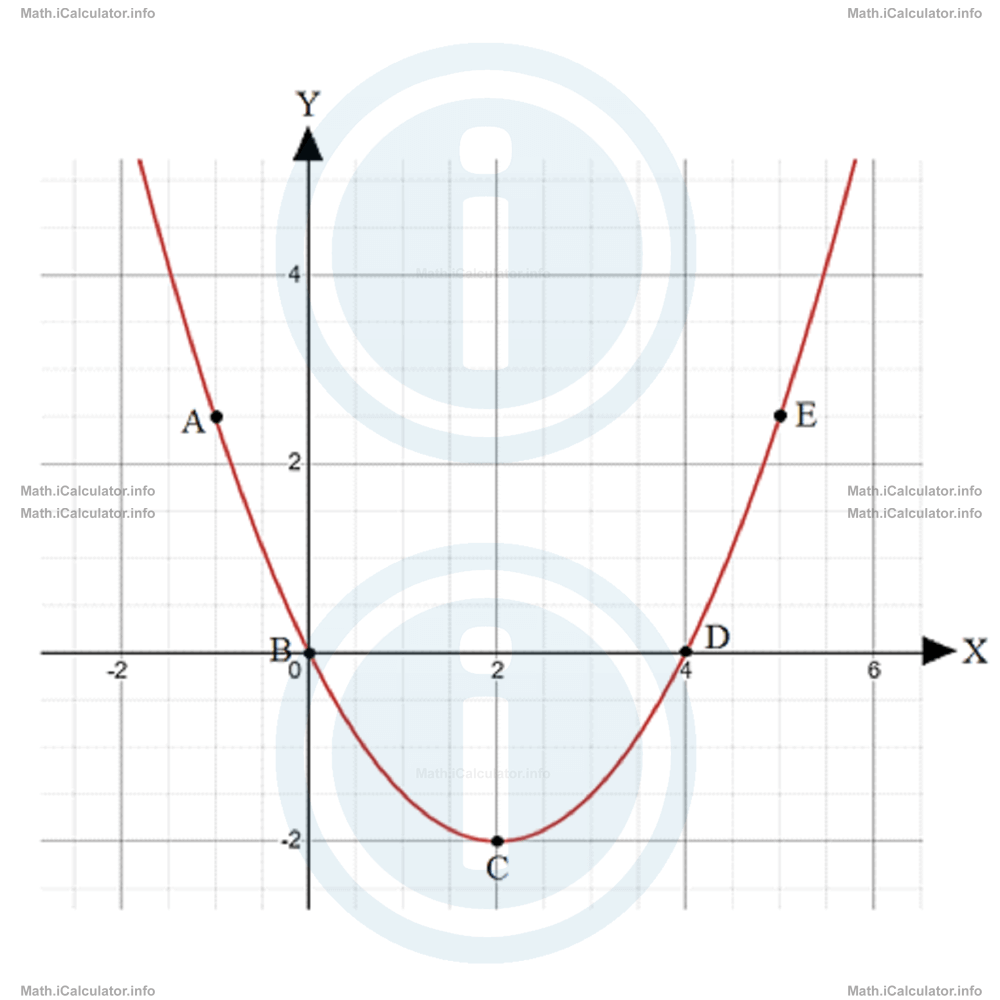
If you have studied our previous tutorial, you will already be familiar with the method used to find the formula of a function shown in the graph. In the specific case, it is clear that this is a quadratic graph, so it has a general formula
Since for x = 0 we have f(0) = 0, it results that the constant c is 0. Therefore, the general form of this function becomes
We can factorise the above function as
The two coefficients a and b are found by solving the equation f(x) = 0. This equation is true for x = 0 or for ax + b = 0. Substituting the x-coordinate of point D yields
Thus,
Therefore, the function becomes
Finally, we can find the coefficient a by substituting the coordinates of another known point (for example C) in the function's formula. Thus, for x = 2 and y = -2 we obtain
-2 = 4a - 8a
-2 = -4a
a = -2/-4
a = 1/2
Hence, the coefficient b is
= 4 ∙ 1/2
= 2
Therefore, the function shown in the graph is
Example 5
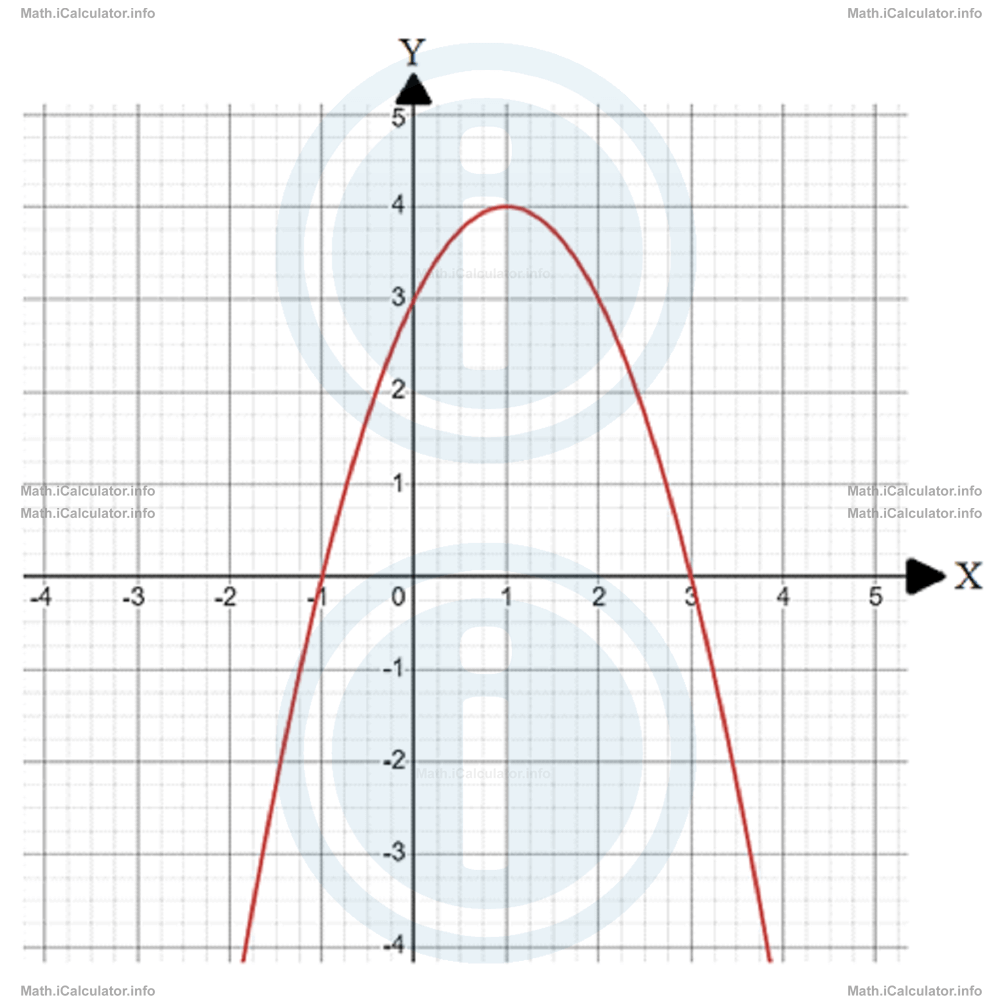
Find the function shown in the graph below.
Solution 5
From the figure, it is clear that this graph belongs to a quadratic function (because the graph is a parabola) where the coefficient a is negative (because the arms of this parabola are directed downwards). The general formula of this function therefore is
The parabola has two x-intercepts (otherwise known as roots, or zeroes): x1 - 1 and xx = 3. For these two values the value of the function is zero, so we can write it as a quadratic equation with one variable
Using the Vieta's formulas
we obtain
2 = -b/a
b = -2a
and
c = -3a
Therefore, the function shown in the graph becomes
= a(x2 - 2x - 3)
To find the unknown coefficient a, we substitute the coordinates of another known point in the above formula. We can choose for example the y-intercept (0, 3). In this way, we obtain
3 = a ∙ (-3)
a = 3/-3
a = -1
Hence, we have
f(x) = -x2 + 2x + 3
You have reached the end of Math lesson 16.2.5 The Graph of a Function. There are 7 lessons in this physics tutorial covering Injective, Surjective and Bijective Functions. Graphs of Functions, you can access all the lessons from this tutorial below.
More Injective, Surjective and Bijective Functions. Graphs of Functions Lessons and Learning Resources
Whats next?
Enjoy the "The Graph of a Function" math lesson? People who liked the "Injective, Surjective and Bijective Functions. Graphs of Functions lesson found the following resources useful:
- Graph Feedback. Helps other - Leave a rating for this graph (see below)
- Functions Math tutorial: Injective, Surjective and Bijective Functions. Graphs of Functions. Read the Injective, Surjective and Bijective Functions. Graphs of Functions math tutorial and build your math knowledge of Functions
- Functions Revision Notes: Injective, Surjective and Bijective Functions. Graphs of Functions. Print the notes so you can revise the key points covered in the math tutorial for Injective, Surjective and Bijective Functions. Graphs of Functions
- Functions Practice Questions: Injective, Surjective and Bijective Functions. Graphs of Functions. Test and improve your knowledge of Injective, Surjective and Bijective Functions. Graphs of Functions with example questins and answers
- Check your calculations for Functions questions with our excellent Functions calculators which contain full equations and calculations clearly displayed line by line. See the Functions Calculators by iCalculator™ below.
- Continuing learning functions - read our next math tutorial: Basic Functions
Help others Learning Math just like you
Please provide a rating, it takes seconds and helps us to keep this resource free for all to use
We hope you found this Math tutorial "Injective, Surjective and Bijective Functions. Graphs of Functions" useful. If you did it would be great if you could spare the time to rate this math tutorial (simply click on the number of stars that match your assessment of this math learning aide) and/or share on social media, this helps us identify popular tutorials and calculators and expand our free learning resources to support our users around the world have free access to expand their knowledge of math and other disciplines.