Menu
Math Lesson 16.2.7 - Function or not a Function? The Vertical Line Test
Please provide a rating, it takes seconds and helps us to keep this resource free for all to use
Welcome to our Math lesson on Function or not a Function? The Vertical Line Test, this is the seventh lesson of our suite of math lessons covering the topic of Injective, Surjective and Bijective Functions. Graphs of Functions, you can find links to the other lessons within this tutorial and access additional Math learning resources below this lesson.
Function or not Function? The Vertical Line Test
In tutorial 13.3 "Modelling Curves using Logarithms", there is a paragraph named "A Brief Introduction to Functions", where we have anticipated the definition of a function and its graph. The following passage about this concept is excerpted from that tutorial:
"A good method for checking whether a given graph represents a function or not is to draw a vertical line in the sections where you have doubts that an x-value may have in correspondence two or more y-values. If the vertical line intercepts the graph at more than one point, that graph does not represent a function."
This feature which allows us to check whether a graph belongs to a function or not, is called the "vertical line test". Not all relations are functions, as we saw in the previous tutorial. Therefore, since every relation between two quantities x and y can be mapped on the XOY coordinates system, the same x-value may have in correspondence two different y-values - points which when shown in a graph, lie in the same horizontal position (the same x-coordinate) but at two different heights (different y-coordinates). Look at the graph of the relation below.

It is obvious that if we draw a vertical line from anywhere on the right of -1, it intercepts the graph at two different points. One of these lines could be the vertical axis; however, we will draw another vertical line to better highlight this feature. For example, if we draw a vertical line at x = 2 we obtain two y-intercepts with the relation's graph: y1 = -3.873 and y2 = 3.873, as shown in the figure below.

The above y-intercepts are found by substituting x = 2 in the original relation and calculating the corresponding y-values. Thus,
= 8 + 4 + 3
= 15
Therefore, since y = √15, we obtain
= -3.87298
≈ -3.873
and
= 3.87298
≈ 3.873
Example 7
Use the vertical line test to determine whether the following graphs represent functions or not.

Solution 7
- This is not a function as, if for example, we draw a vertical line at x = -3, this line intercepts the graph at two different points A and B, as shown in the figure.
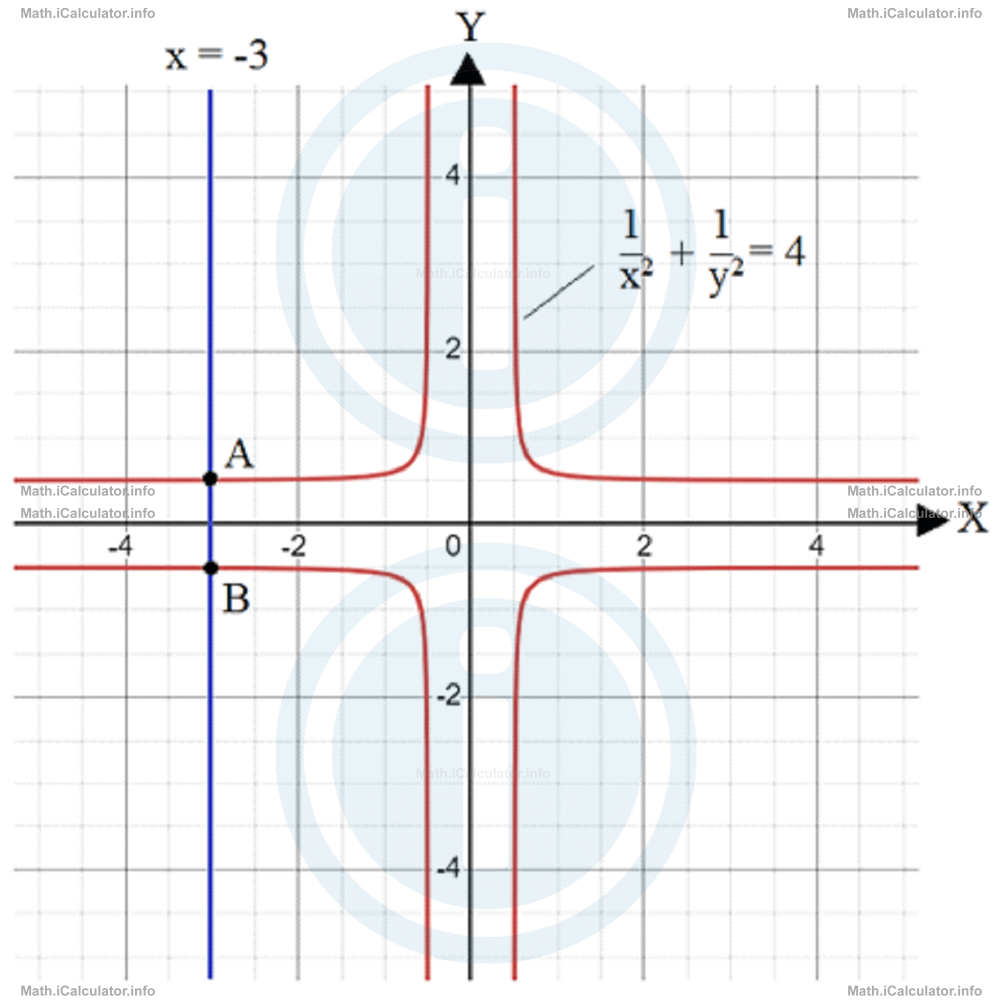 The y-intercepts of A and B are: 1/32 + 1/y2 = 4Hence, the two intercepts are: A(-3, -0.507) and B(-3, 0.507).
1/9 + 1/y2 = 4
1/y2 = 4 - 1/9
1/y2 = 36/9 - 1/9
1/y2 = 35/9
y2 = 9/35
y = √9/35
= ±√9/√35
= ±3/5.916
= ±0.507 - This is the graph of a circle with centre at C(1, 0) and radius 3 units. Therefore, if we draw a vertical line through the centre (x = 1), it intercepts the circle at two different points A and B, as shown in the figure.
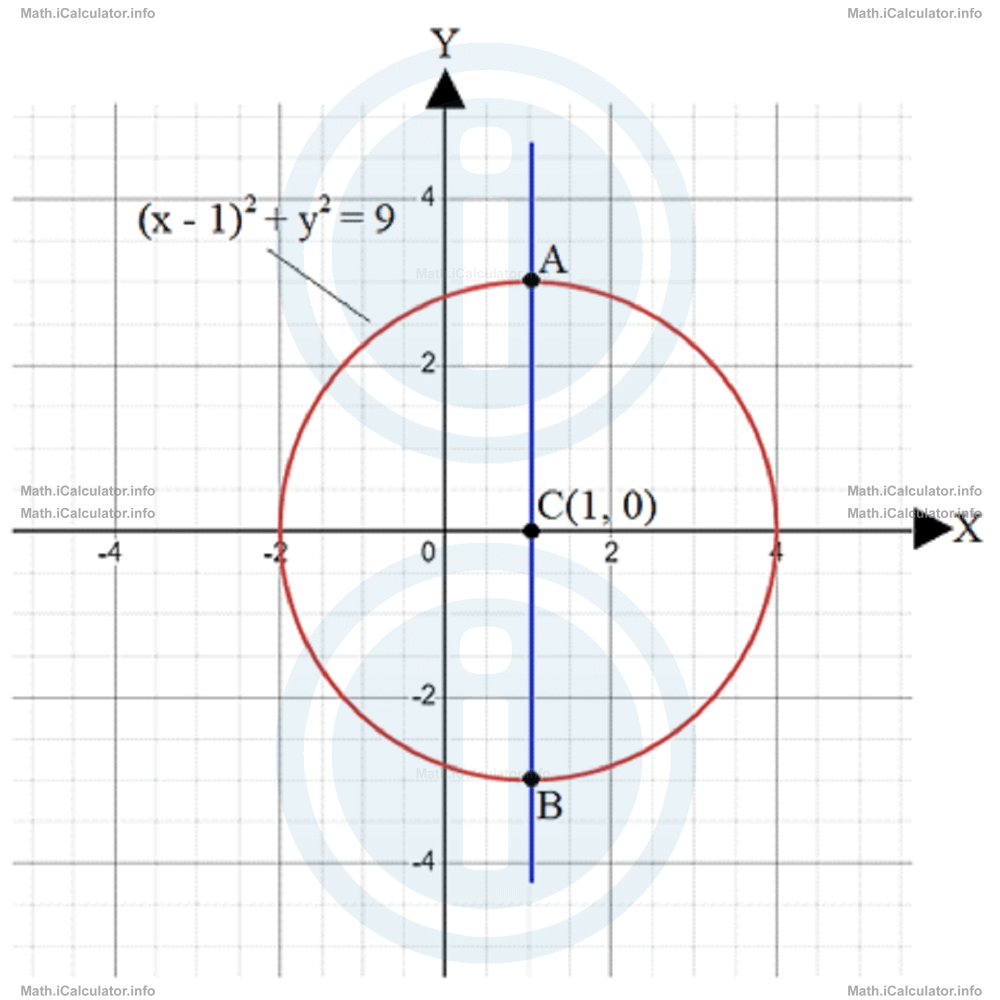 The two y-intercepts are found by substituting x = 1 in the formula of the original relation. Thus, (1-1)2 + y2 = 9Therefore, the two intercepts are: A(1, -3) and B(1, 3).
02 + y2 = 9
y2 = 9
y = √9
y = ±3 - This is the graph of a polynomial function, as the original expression it can be written in the form 4y = x3 + 3x2 - 1ory = 1/4 x3 + 3/4 x2 - 1/4The vertical line test cannot identify any part of the graph in which there are two y-coordinates for a single x-coordinate, despite the multiple attempts in this regard, as shown in the figure below.
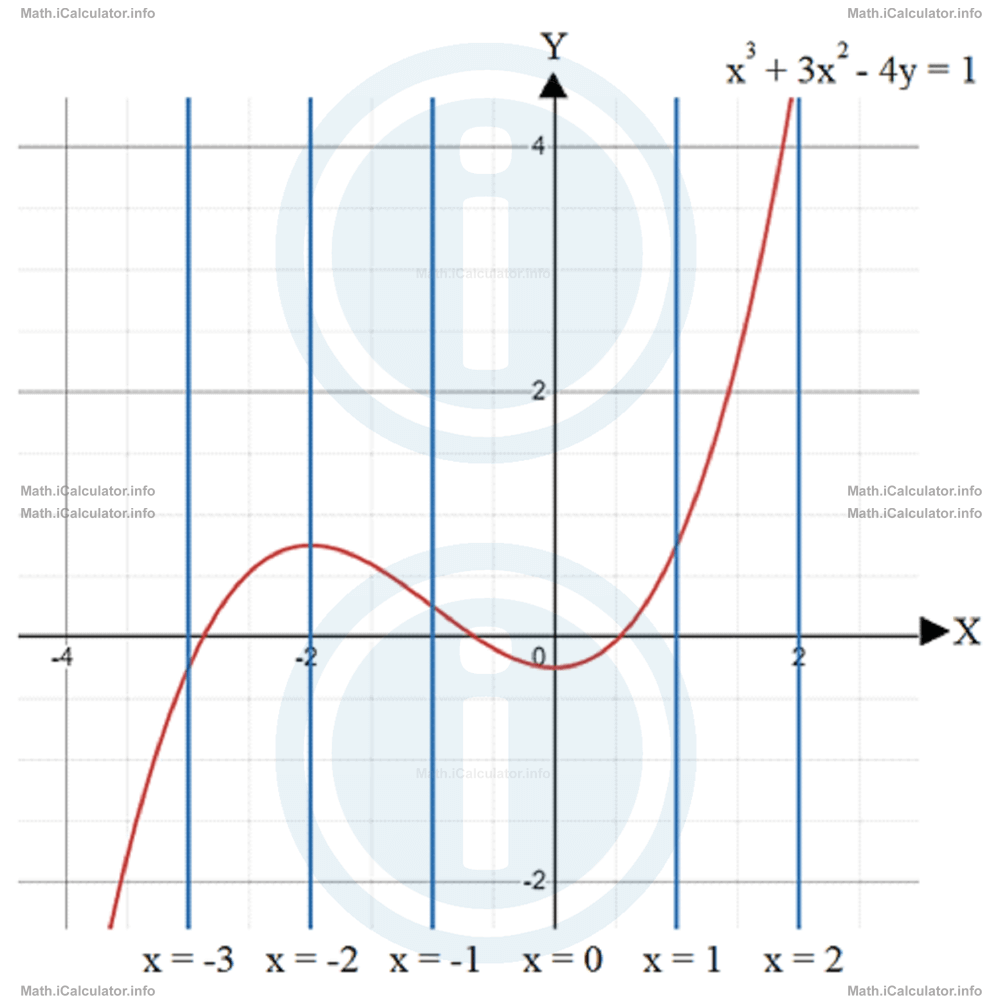 Therefore, the vertical test cannot identify any point of the graph with two y-coordinates for the same x-coordinate. Hence, this is a function.
You have reached the end of Math lesson 16.2.7 Function or not a Function? The Vertical Line Test. There are 7 lessons in this physics tutorial covering Injective, Surjective and Bijective Functions. Graphs of Functions, you can access all the lessons from this tutorial below.
More Injective, Surjective and Bijective Functions. Graphs of Functions Lessons and Learning Resources
Whats next?
Enjoy the "Function or not a Function? The Vertical Line Test" math lesson? People who liked the "Injective, Surjective and Bijective Functions. Graphs of Functions lesson found the following resources useful:
- Vertical Feedback. Helps other - Leave a rating for this vertical (see below)
- Functions Math tutorial: Injective, Surjective and Bijective Functions. Graphs of Functions. Read the Injective, Surjective and Bijective Functions. Graphs of Functions math tutorial and build your math knowledge of Functions
- Functions Revision Notes: Injective, Surjective and Bijective Functions. Graphs of Functions. Print the notes so you can revise the key points covered in the math tutorial for Injective, Surjective and Bijective Functions. Graphs of Functions
- Functions Practice Questions: Injective, Surjective and Bijective Functions. Graphs of Functions. Test and improve your knowledge of Injective, Surjective and Bijective Functions. Graphs of Functions with example questins and answers
- Check your calculations for Functions questions with our excellent Functions calculators which contain full equations and calculations clearly displayed line by line. See the Functions Calculators by iCalculator™ below.
- Continuing learning functions - read our next math tutorial: Basic Functions
Help others Learning Math just like you
Please provide a rating, it takes seconds and helps us to keep this resource free for all to use
We hope you found this Math tutorial "Injective, Surjective and Bijective Functions. Graphs of Functions" useful. If you did it would be great if you could spare the time to rate this math tutorial (simply click on the number of stars that match your assessment of this math learning aide) and/or share on social media, this helps us identify popular tutorials and calculators and expand our free learning resources to support our users around the world have free access to expand their knowledge of math and other disciplines.