Menu
Math Lesson 13.3.4 - Logarithmic Function Graphs
Please provide a rating, it takes seconds and helps us to keep this resource free for all to use
Welcome to our Math lesson on Logarithmic Function Graphs, this is the fourth lesson of our suite of math lessons covering the topic of Modelling Curves using Logarithms, you can find links to the other lessons within this tutorial and access additional Math learning resources below this lesson.
Logarithmic Function Graphs
A logarithmic function is a function that has the variable in the argument of a logarithm. The simplest logarithmic function is
More advanced forms of logarithmic functions include
The graph of a logarithmic function (equation) shows the line that includes all points that make the equation true. For example, we have the graph of the function y(x) = log3 x shown in the figure below.
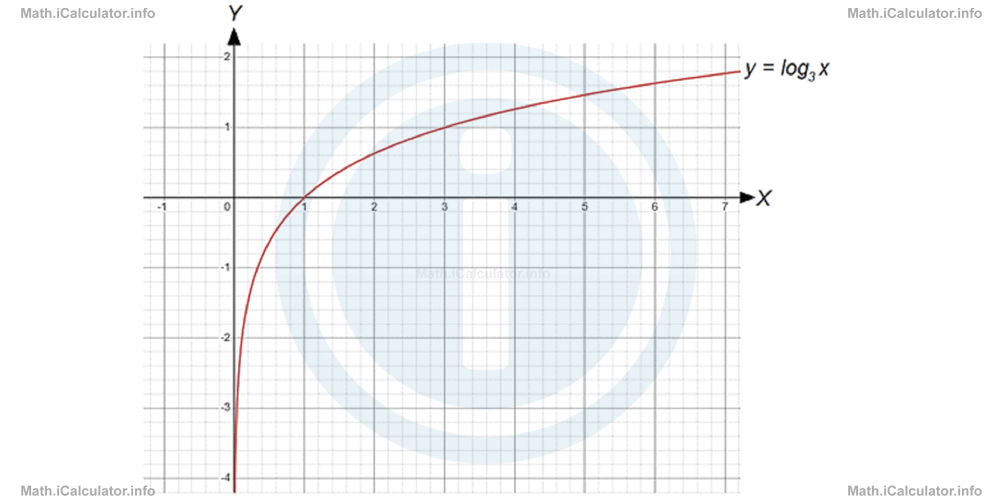
The graph of a logarithmic function is a curve that extends to infinity on three sides but has some limitations on the other, depending on the value of the base and the sign of the exponent. For example, the above graph is unlimited in both vertical directions and on the right but it is limited on the left (x cannot be zero or negative).
The best method to plot the graph of an exponential or logarithmic function is to find as many points of the graph as possible. If the formula of the function is known, we can provide some arbitrary values to the independent variable x and then calculate the corresponding y-values.
We have four types of numbers (coefficients or constants) that affect the shape and orientation of a logarithmic function graph. Thus, if we express the general form of a logarithmic equation as
which can also be written as
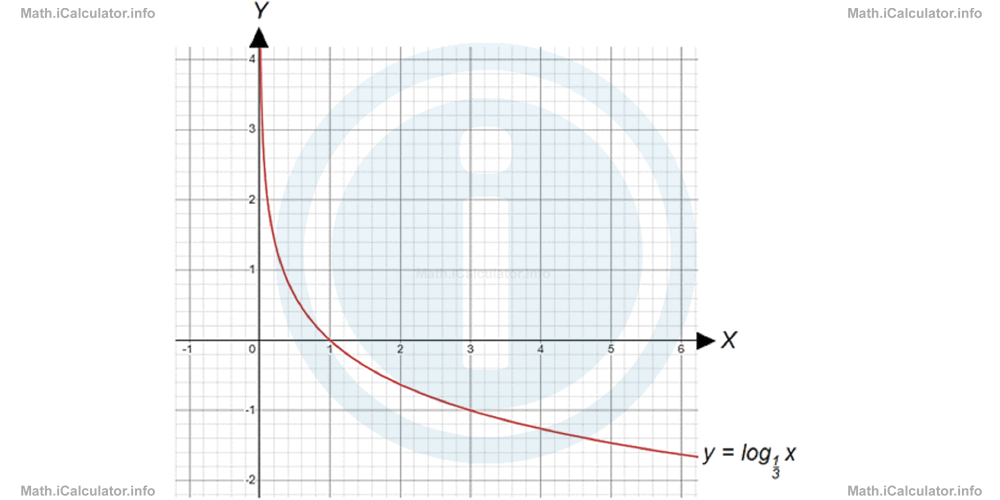
then, the numbers involved are a, b, m and n, where their values and signs determine the orientation and dimensions of the graph, as in the exponential functions. For example, the graph of the logarithmic function
is the vertically inverted version of y(x) = log3 x, as shown in the figure below.
We can find the values of the coefficients involved in the logarithmic function y(x) = m/n logax by solving the simplest form of the logarithmic obtained when substituting the coordinates of one known point of the graph. This allows us to find two unknowns at once: the base a and the coefficient m/n preceding the logarithm. Then, if necessary, we can attempt to find the values of m and n separately, given that they are whole numbers and the number of possible combinations is therefore limited.
Let's consider for example the following logarithmic function graph.
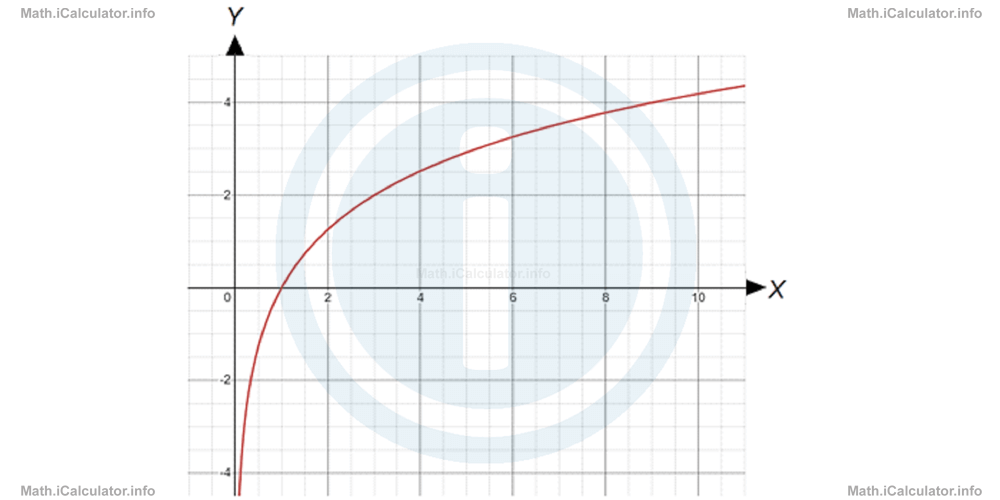
From the figure, we can identify two clear points on the graph: (3, 2) and (9, 4). Therefore, substituting one of them (for example the first) in the standard form of the logarithmic function
yields
a2 = 3
a = √3
We write this value as a fractional power. In this way, we obtain for the base a of the logarithmic function
Therefore, we write the logarithmic function shown by the graph as
However, this is not the standard form of writing a logarithmic function. Given the property of logarithm
we obtain
y(x) = 1/1/2 log3 x
and finally,
If you wish, you can also write this logarithm as
From the above numbers, we can guess the values of m and n since m/n = 2. Thus, the most common version of this function would require that m = 2 and n = 1, but other combinations are also possible.
Example 2
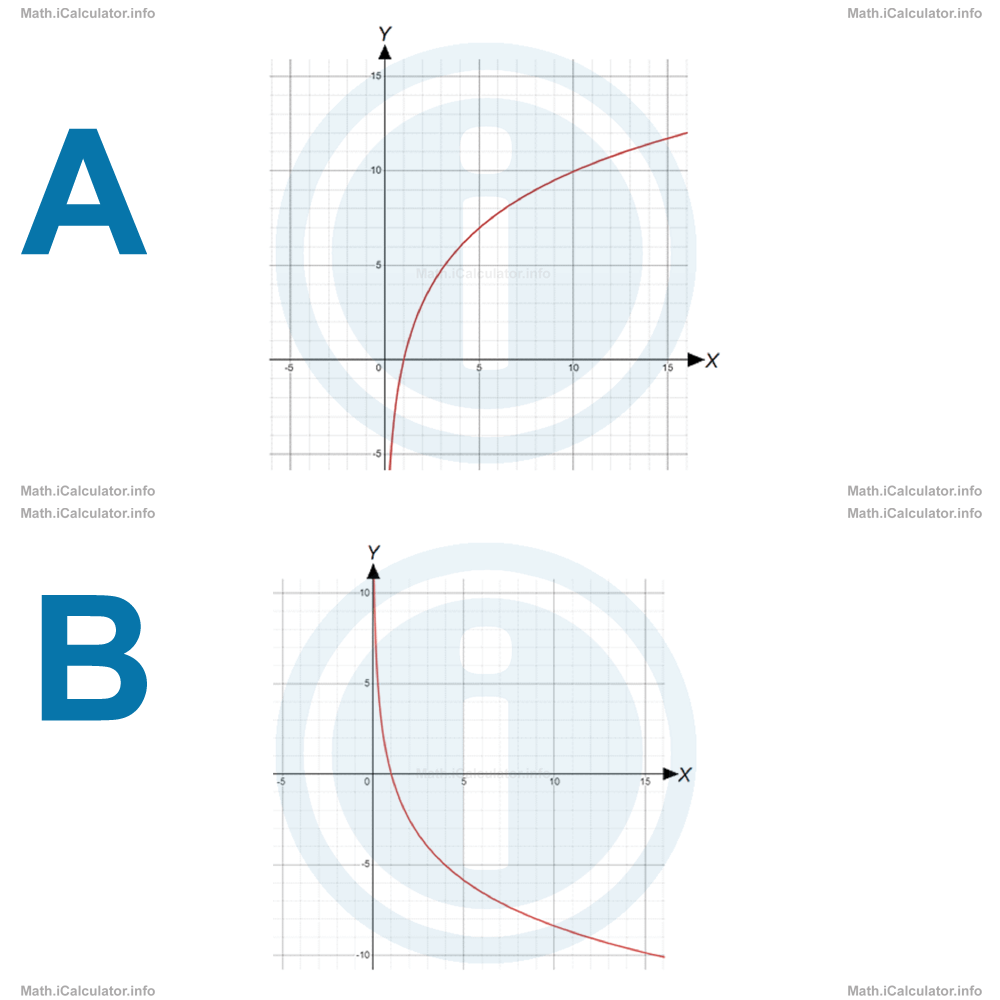
What are the logarithmic functions that corresponds to the following graphs?
Solution 2
- First, let's search for any clear point on the graph. For example, point (5, 7) has distinct coordinates, so it is suitable to be considered. Thus, considering the standard form of a logarithmic equation y(x) = loga xwe obtain after substituting x = 10 and y = 10:7 = loga 5Therefore, we obtain for the logarithmic function shown by the graph:
a7 = 5
(a7 )1/7 = 51/7
a = 51/7y(x) = log51/7 x
y(x) = 1/1/7 log5 x
y(x) = 7 log5 x - Again, let's identify a clear point of the graph first. We can easily see that (3, -4) is a point of the graph. Thus, considering the standard form of a logarithmic equation y(x) = loga xwe obtain after substituting x = 3 and y = -4:-4 = loga 3Although the base of a logarithmic function is always taken as positive, we will close an eye here to a "rule violation", as after the necessary transformations the base will be positive at the end. Therefore, the function shown in the graph is
a-4 = 3
a-4 = 3
(a-4 )-1/4 = 3-1/4
a = 3-1/4y(x) = log3-1/4 xHence, the ultimate form of this function is
y(x) = 1/-1/4 log3 xy(x) = -4 log3 x
More Modelling Curves using Logarithms Lessons and Learning Resources
Whats next?
Enjoy the "Logarithmic Function Graphs" math lesson? People who liked the "Modelling Curves using Logarithms lesson found the following resources useful:
- Logarithmic Function Graphs Feedback. Helps other - Leave a rating for this logarithmic function graphs (see below)
- Logarithms Math tutorial: Modelling Curves using Logarithms. Read the Modelling Curves using Logarithms math tutorial and build your math knowledge of Logarithms
- Logarithms Video tutorial: Modelling Curves using Logarithms. Watch or listen to the Modelling Curves using Logarithms video tutorial, a useful way to help you revise when travelling to and from school/college
- Logarithms Revision Notes: Modelling Curves using Logarithms. Print the notes so you can revise the key points covered in the math tutorial for Modelling Curves using Logarithms
- Logarithms Practice Questions: Modelling Curves using Logarithms. Test and improve your knowledge of Modelling Curves using Logarithms with example questins and answers
- Check your calculations for Logarithms questions with our excellent Logarithms calculators which contain full equations and calculations clearly displayed line by line. See the Logarithms Calculators by iCalculator™ below.
- Continuing learning logarithms - read our next math tutorial: Natural Logarithm Function and Its Graph
Help others Learning Math just like you
Please provide a rating, it takes seconds and helps us to keep this resource free for all to use
We hope you found this Math tutorial "Modelling Curves using Logarithms" useful. If you did it would be great if you could spare the time to rate this math tutorial (simply click on the number of stars that match your assessment of this math learning aide) and/or share on social media, this helps us identify popular tutorials and calculators and expand our free learning resources to support our users around the world have free access to expand their knowledge of math and other disciplines.