Menu
Math Lesson 15.5.2 - Exponential Function's Graph. Asymptotes of Exponential Graphs
Please provide a rating, it takes seconds and helps us to keep this resource free for all to use
Welcome to our Math lesson on Exponential Function's Graph. Asymptotes of Exponential Graphs, this is the second lesson of our suite of math lessons covering the topic of Exponential Graphs, you can find links to the other lessons within this tutorial and access additional Math learning resources below this lesson.
Exponential Function's Graph. Asymptotes of Exponential Graphs
First, let's assume the base of all exponential functions discussed in this tutorial to be positive unless the existence of a negative base is stated explicitly. Moreover, we will first see how to plot the graph of the simplest form of an exponential function, i.e. of the function
Thus, since a positive number raised at any power is always positive, it is obvious that the y-values in the simplest form of an exponential function shown above are positive as well. Therefore, we have some limitations in the possible values an exponential function can take. Exponential functions always take the sign of the base a for every value of the independent variable. For example, in the function
all values of y are positive, for any value of the independent variable x chosen because the base a is positive (a = 2). Thus, for x = 3 we have y(3) = 23 = 8 (positive). Likewise, for x = -6, we have y(-6) = 2 - 6 = 1/26 = 1/64 (positive). Therefore, for this function, the Y-axis acts as a horizontal asymptote, as shown in the figure below.
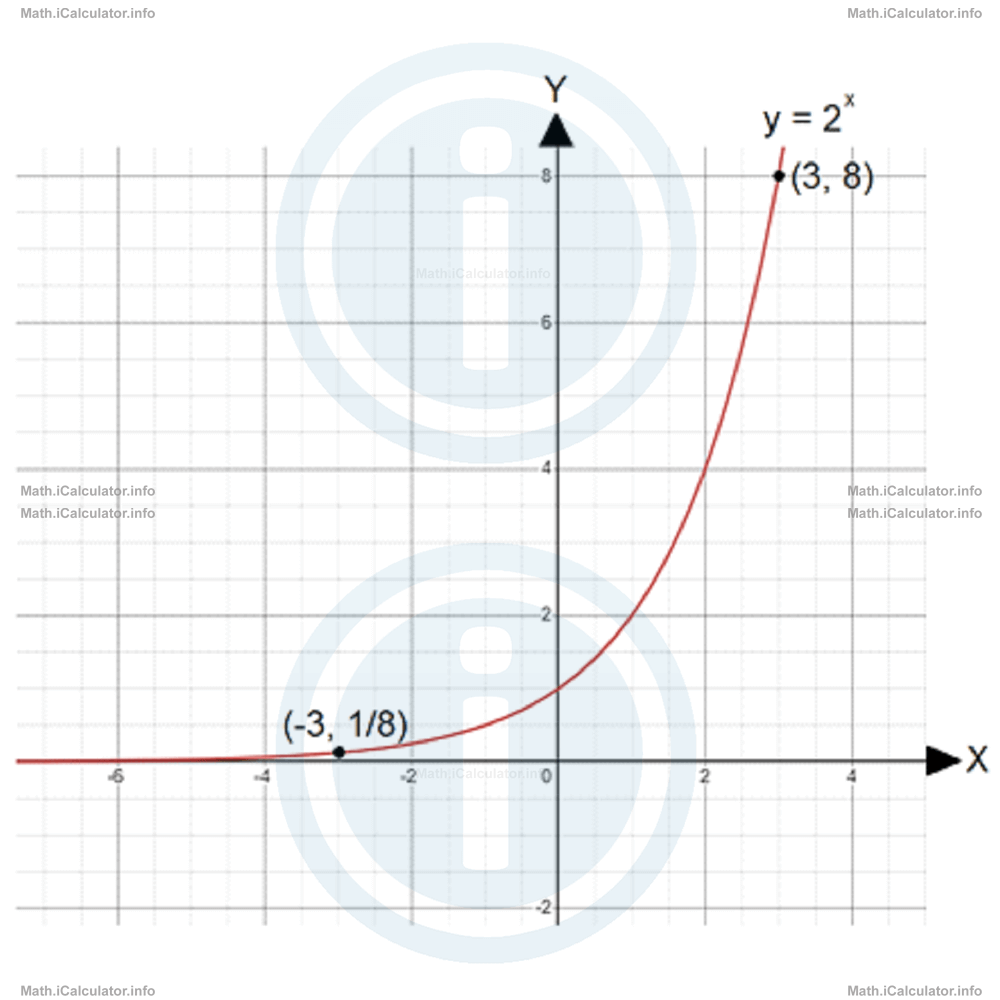
On the other hand, the graph of an exponential function doesn't have any vertical asymptote, as there are no limitations in the values of x in such functions.
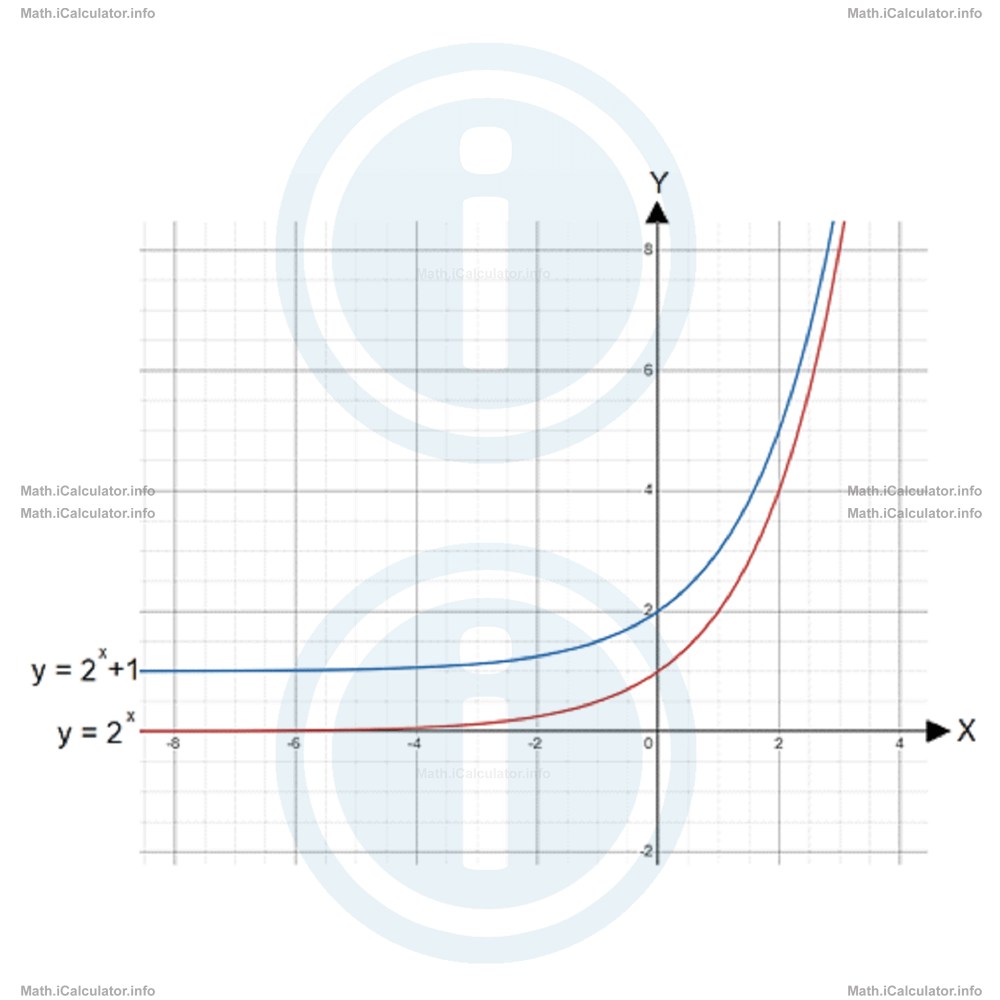
When the constant t is present in an exponential function, it makes the graph shift by t units above or below the same function that does not include this constant (above when t > 0 and below when t < 0). For example, the graph of the exponential function y(x) = 2x + 1 is one unit above the graph of y(x) = 2x because t = 1. In such cases, the function y(x) = ax is known as the parent function of y(x) = ax + t. This is because the second function derives from the first one with some extra accessories (here, by adding t to each y-value of the parent function). Hence, it is obvious that both functions have the same features but do not occupy the same position in the coordinates system. Look at the figure below where both graphs are shown in the same coordinates system.
Example 2
Without plotting the graph, find the equation of asymptotes in the following exponential equations and interpret the results.
- y = 4x - 1/3
- y = 3x + 2
Solution 2
First, let's find the asymptotes of the two parent functions, y = 4x and y = 3x. Thus, since both bases are positive (4 and 3 respectively), all y-values in the two functions are positive. Therefore, y = 0 is the horizontal asymptote for both parent functions. As for the given functions, they are obtained by adding or subtracting the value of the constant t to the corresponding parent functions. This constant also gives the horizontal asymptote of each functions. In this way, we have
- a = 4 and t = -1/3. The horizontal asymptote (H.A.) is y = t = -1/3. In this way, the graph of y(x) = 4x - 1/3 is 1/3 units below the graph of y(x) = 4x.
- a = 3 and t = 2. The horizontal asymptote (H.A.) is y = t = 2. In this way, the graph of y(x) = 3x + 2 is 2 units above the graph of y(x) = 3x.
You have reached the end of Math lesson 15.5.2 Exponential Function's Graph. Asymptotes of Exponential Graphs. There are 8 lessons in this physics tutorial covering Exponential Graphs, you can access all the lessons from this tutorial below.
More Exponential Graphs Lessons and Learning Resources
Whats next?
Enjoy the "Exponential Function's Graph. Asymptotes of Exponential Graphs" math lesson? People who liked the "Exponential Graphs lesson found the following resources useful:
- Graph Feedback. Helps other - Leave a rating for this graph (see below)
- Types of Graphs Math tutorial: Exponential Graphs. Read the Exponential Graphs math tutorial and build your math knowledge of Types of Graphs
- Types of Graphs Revision Notes: Exponential Graphs. Print the notes so you can revise the key points covered in the math tutorial for Exponential Graphs
- Types of Graphs Practice Questions: Exponential Graphs. Test and improve your knowledge of Exponential Graphs with example questins and answers
- Check your calculations for Types of Graphs questions with our excellent Types of Graphs calculators which contain full equations and calculations clearly displayed line by line. See the Types of Graphs Calculators by iCalculator™ below.
- Continuing learning types of graphs - read our next math tutorial: Circle Graphs
Help others Learning Math just like you
Please provide a rating, it takes seconds and helps us to keep this resource free for all to use
We hope you found this Math tutorial "Exponential Graphs" useful. If you did it would be great if you could spare the time to rate this math tutorial (simply click on the number of stars that match your assessment of this math learning aide) and/or share on social media, this helps us identify popular tutorials and calculators and expand our free learning resources to support our users around the world have free access to expand their knowledge of math and other disciplines.